Figures & data
Table 1 Baseline Characteristics at Inclusion by Group
Figure 1 Head map showing the 7-point ordinal WHO scale across the study period of 24 weeks. Number refers to patients’ identification in the study.
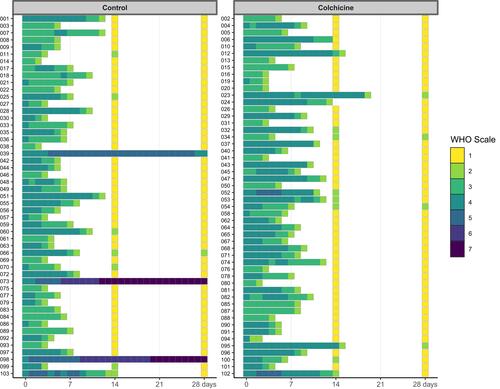
Table 2 Study End-Points by Group
Figure 2 Adjusted multiple logistic regression analysis for the event of 1-point deterioration on the WHO scale of clinical severity. Age, Il-6, and ferritin were dichotomized above the median value.
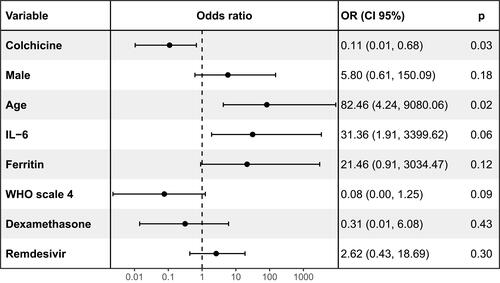
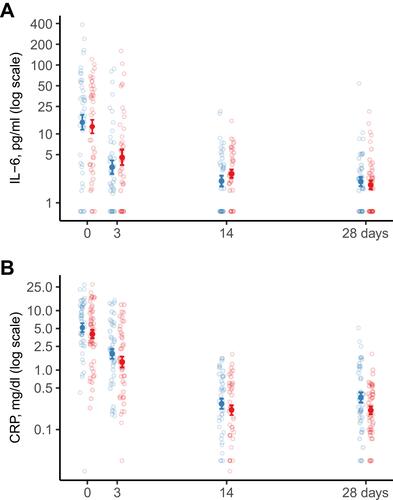
Figure 3 Concentrations of IL-6 (panel A) and C-reactive protein (panel B) in the colchicine group (red) and the control group (blue).