Figures & data
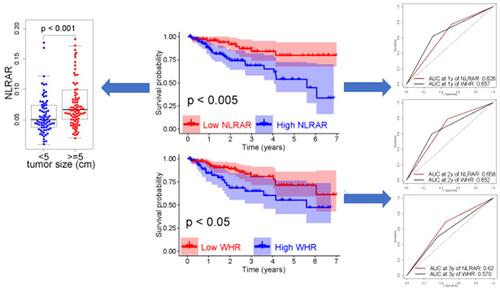
Table 1 Clinicopathological Variables of the Enrolled Patients
Figure 1 Cut-off values identified using the X-tile software.
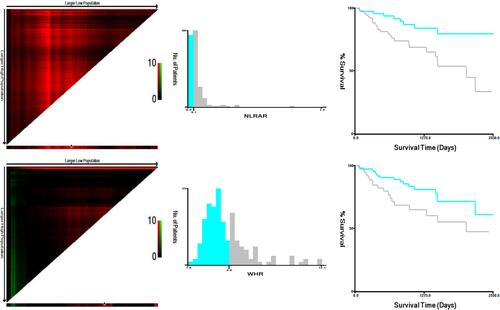
Figure 2 Kaplan–Meier survival curves plotted using data collected from HCC patients undergoing hepatectomy for overall survival. (A) Overall survival rates stratified by NLRAR. (B) Overall survival rates stratified by WHR. (C) Overall survival rates stratified by NWS.
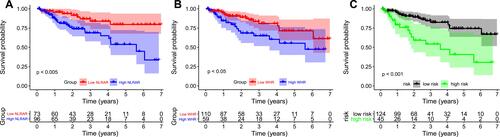
Table 2 Univariate and Multivariate Cox Analyses of Inflammation Markers for Overall Survival
Figure 3 The predictive power of inflammation markers in overall survival rates for HCC patients undergoing hepatectomy. (A–C) Receiver operating characteristic curve analysis for inflammation markers for 1-, 2- and 3-year overall survival rates. (D) Decision curve analysis (DCA) for inflammation markers at clinical benefits.
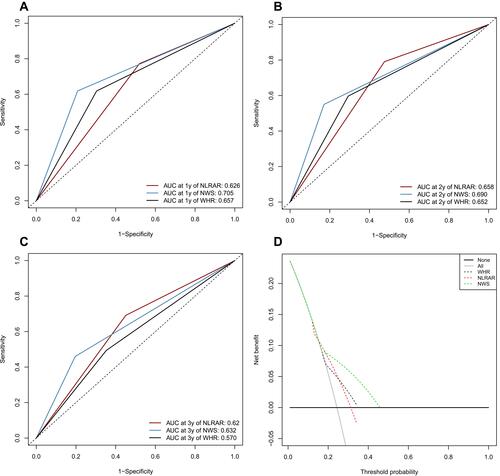
Figure 4 Subgroup analyses for inflammation markers in HCC patients undergoing hepatectomy stratified by different tumor stages. (A–C) Kaplan-Meier survival curves for overall survival rates at tumor stage I. (D–F) Kaplan-Meier survival curves for overall survival rates at tumor stages II–III. (G–I) Receiver operating characteristic curve analysis for the determination of 1-, 2- and 3-year overall survival rates at tumor stage I.
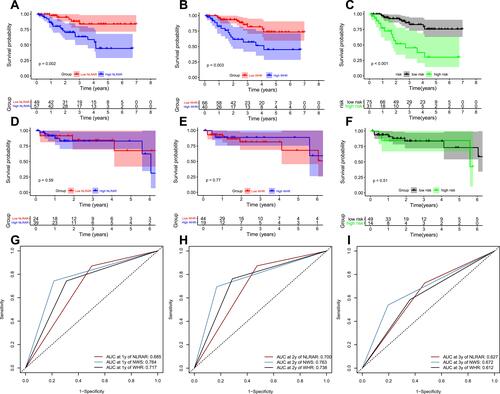
Figure 5 Correlations between inflammation markers and clinicopathological features.
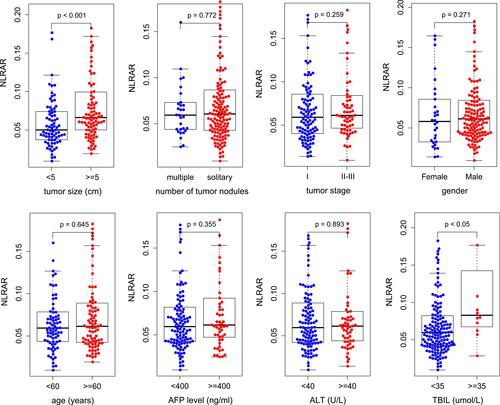
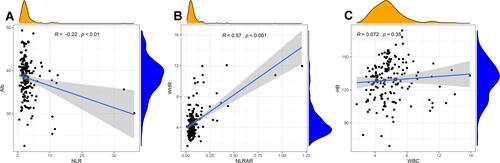
Figure 6 Pearson correlation analysis. (A) Negative correlation between albumin and NLR; (B) positive correlation between WHR and NLRAR. (C) No significant correlation was observed between hemoglobin and white blood cell.