Figures & data
Table 1 The Top 10 Differential Expressed Genes (DEGs) in the Left Ventricular Myocardial Tissue of Patients with Ischemic Cardiomyopathy in GSE116250, GSE46224, GSE5406
Table 2 Co-Expressed Differential Expressed Genes (co-DEGs)
Figure 1 Volcano plot and heat map of all the differentially expressed genes (DEGs) between Non-failure patients and heart failure patients in cardiac tissues. (A), volcano plot of DEGs in GSE116250 dataset; (B), volcano plot of DEGs in GSE46224 dataset; (C), volcano plot of DEGs in GSE5406 dataset; Green dot represent DEGs with fold change <-1, red dot represents DEGs with fold change >1, adjust P <0.05. (D), heat map of DEGs in GSE116250 dataset; (E), heat map of DEGs in GSE46224 dataset; (F), heat map of DEGs in GSE5406 dataset; The gradient colour change from blue to red represents the changing process from downregulation to upregulation.
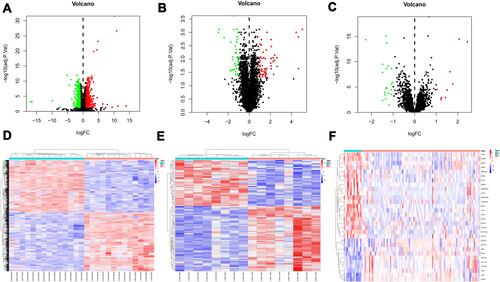
Figure 2 Functional enrichment analysis of common differentially expressed genes (co-DEGs). (A), Venn diagram of co-DEGs; (B), Gene Ontology (GO) analysis of co-DEGs regard to biological process (BP), cellular component (CC), and molecular function (MF).
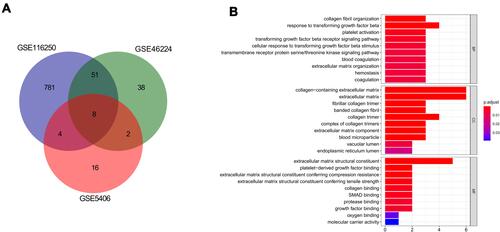
Figure 3 Gene Ontology (GO) analysis of all DEGs. (A) the top 10 enriched GO terms in biological process (BP), cellular component (CC), and molecular function (MF) of GSE116250 dataset; (B), the top 10 enriched GO terms in biological process (BP), cellular component (CC), and molecular function (MF) of GSE462224 dataset; (C), the top 10 enriched GO terms in biological process (BP), cellular component (CC), and molecular function (MF) of GSE5406 dataset.
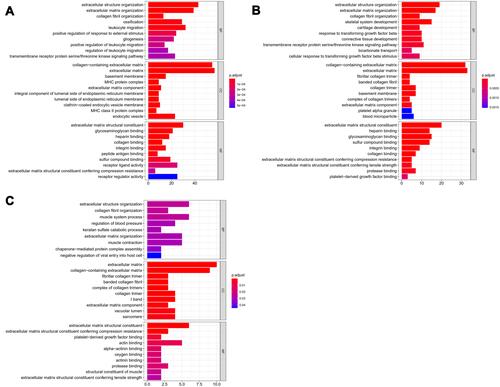
Figure 4 Kyoto Encyclopedia of Genes and Genomes (KEGG) pathways analysis of all DEGs. (A), the enriched KEGG pathways in co-DEGs; (B), the enriched KEGG pathways of DEGs in GSE116250 dataset; (C), the enriched KEGG pathways of DEG in GSE46224 dataset; (D), the enriched KEGG pathways in GSE5406 dataset.
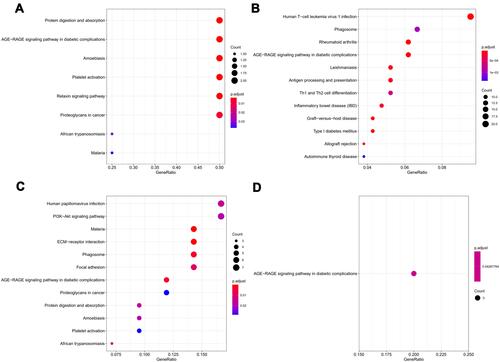
Figure 5 Protein–protein interaction (PPI) network analysis. (A), PPI network of co-DEGs identified by Cytoscape; (B and C), PPI network and hub gene of DEGs in GSE116250; (D and E), PPI network and hub gene of DEGs in GSE46224; (G and H), PPI network and hub gene of DEGs in GSE5406.
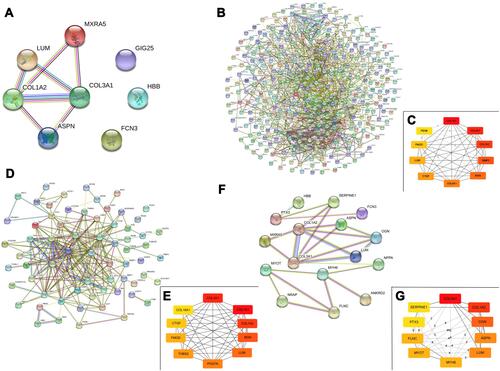
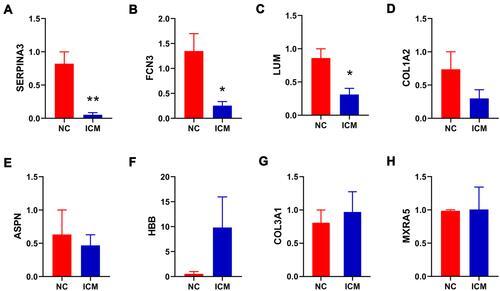
Figure 6 Relative gene expression verification of eight co-DEGs. The expression of SERPINA3 (A), FCN3 (B), LUM (C), COL1A2 (D), ASPN (E), HBB (F), COL3A1 (G), MXRA5 (H) were measured by real time-qPCR. *P < 0.05; **P < 0.01.