
Figures & data
Table 1 Weighted Characteristics of Study Sample Based on Age
Figure 1 Research flow chart.
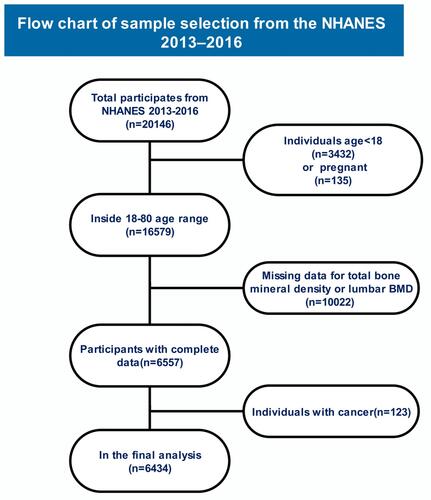
Table 2 Correlation Between BMD in Different Parts and Fasting Glucose/Sex Hormones
Table 3 Associations Between Sex Steroid Hormone (nmol/L) and Lumbar BMD
Table 4 Associations Between Sex Steroid Hormone (nmol/L) and Pelvis BMD
Table 5 Associations Between Sex Steroid Hormone (nmol/L) and Total BMD
Table 6 Compared Sex Steroid Hormone (nmol/L) with Fasting Glucose to BMD
Figure 2 Group 1: FBG ≤6.0 and low sex steroid hormone level; group 2: FBG >6.0 and low sex steroid hormone level; group 3: FBG ≤6.0 and high sex steroid hormone level; group 4: FBG >6.0 and high sex steroid hormone level. The data are presented as the means ±SD. Statistical analysis was performed by two-way analysis of variance with all pairwise multiple comparison procedures done by Tukey's method, *p<0.001 vs group 1; **p<0.001 vs group 2.
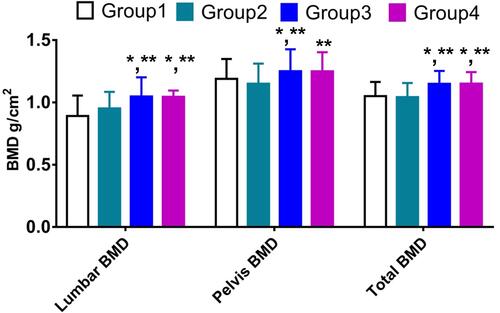
Table 7 Multivariate Regression Analysis of SHBG on BMD
Table 8 Compared Sex Steroid Hormone (nmol/L) with Sex to BMD