Figures & data
Figure 1 Schematic diagram.
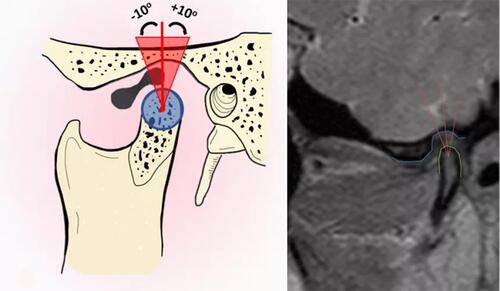
Figure 2 Sketch map of temporomandibular joint: normal TMJ(A); disc displacement of TMJ with reduction(B); disc displacement of TMJ without reduction(C).
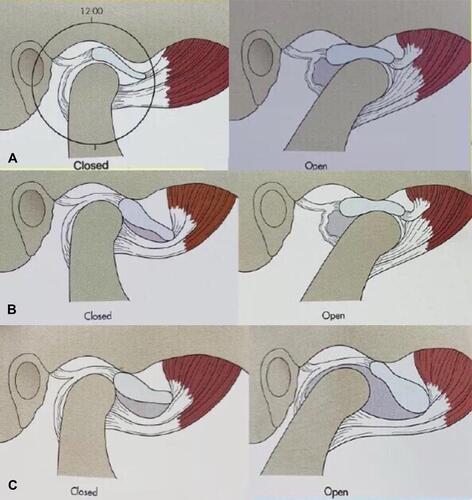
Figure 3 Normal temporomandibular joint in adolescents: closed-mouth position (A), open-mouth position (B), and T2 mapping image artifact (C).
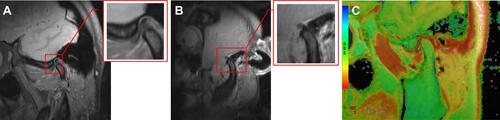
Figure 4 Disc displacement of temporomandibular joint with reduction in adolescents: closed-mouth position (A), open-mouth position (B), and T2 mapping image artifact (C).
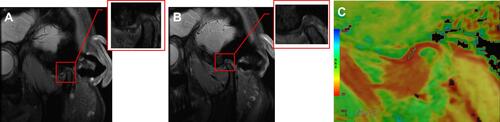
Figure 5 Disc displacement of temporomandibular joint without reduction in adolescents: closed-mouth position (A), open-mouth position (B), and T2 mapping image artifact (C).
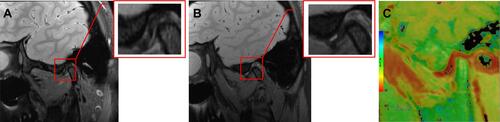
Table 1 Comparison of Parameters Between Patients with Normal Articular Discs of Temporomandibular Joints and Those with Articular Discs of Temporomandibular Joints with Temporomandibular Disorders
Figure 6 T2 mean value.
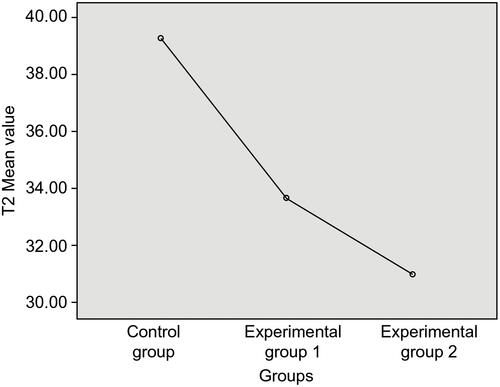
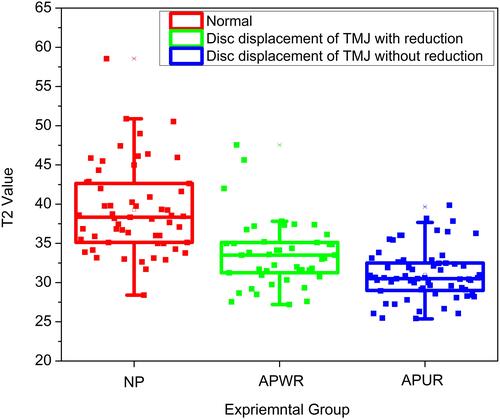
Figure 7 T2 value box plot.
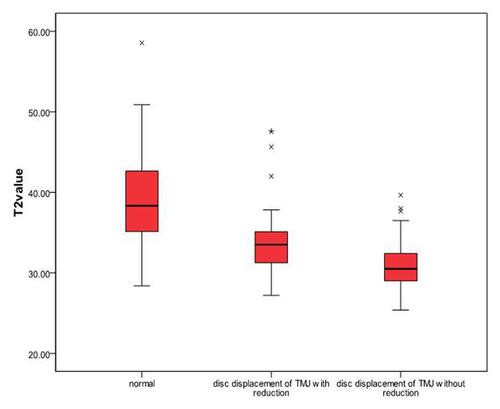
Figure 8 T2 value box plot and scatter plot overlay.