Figures & data
Table 1 Clinical Characteristics of Patients with Pleural Effusion
Figure 1 The percentage of Tregs and Th17 cells from PBMCs and PEMCs. (A) Dot plots of CD4+CD25+Foxp3+Helios+ Tregs in PBMCs from patients with NSCLC. (B and C) representative dot plots of CD4+CD25+Foxp3+Helios+ Tregs and CD4+CD25+Foxp3+ RORγt+ Tregs in PEMCs from the same patient with NPE, respectively. (D and E) representative dot plots of CD4+CD25+Foxp3+Helios+ Tregs and CD4+CD25+Foxp3+RORγt+ Tregs in the PEMCs from the same patient with NSCLC, respectively.
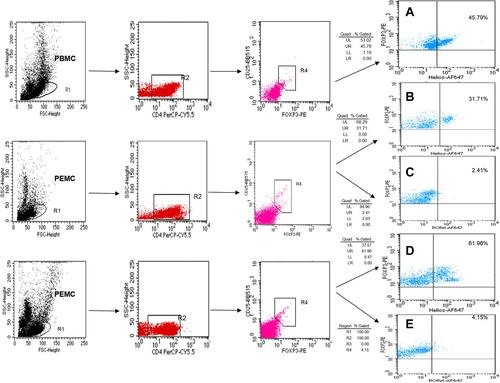
Figure 2 Association between the level of Helios+ Tregs and the ratio of Th17/Tregs on patient survival. (A) The proportion of Tregs and Th17 cells from PBMCs and PEMCs. (B) The level of IRF4 mRNA expression in MPE and NPE. (C) Patients with a higher population of Helios+ Tregs in the MPE had a significantly shorter survival time than those with lower population of Helios+ Tregs (P = 0.012). (D) Patients with a high ratio of Th17/Tregs in MPE had a longer survival time than those with a low ratio of Th17/Tregs (P = 0.016). *P < 0.05; **P < 0.01.
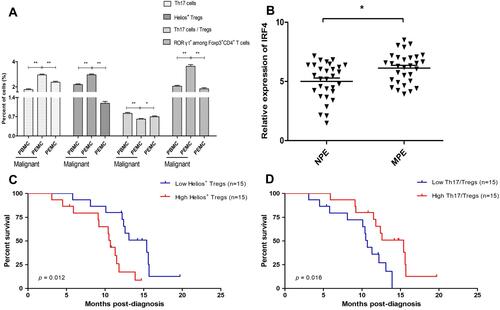
Figure 3 Scatter diagram of the correlation between IRF4 expression and population of Foxp3+RORγt+ Tregs. IRF4 expression is positively associated with the frequency of CD4+CD25+Foxp3+RORγt+ Tregs (60 patients with PE).
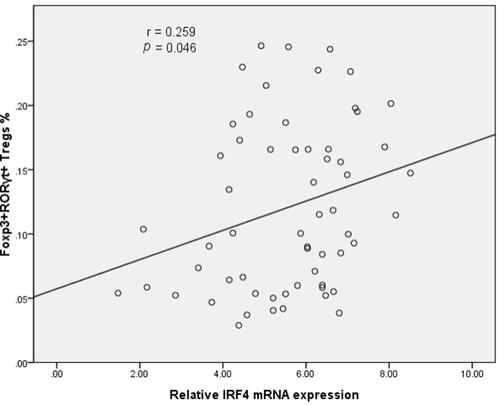
Figure 4 The generation of induced Tregs. (A) Freshly isolated CD4+CD25− T cells from PEMCs of an NSCLC patient by magnetic bead sorting. (B and C) CD4+CD25+Foxp3+ Tregs were produced by cytokine stimulation. (D and E) Helios expression in induced Tregs and non-Tregs, respectively.
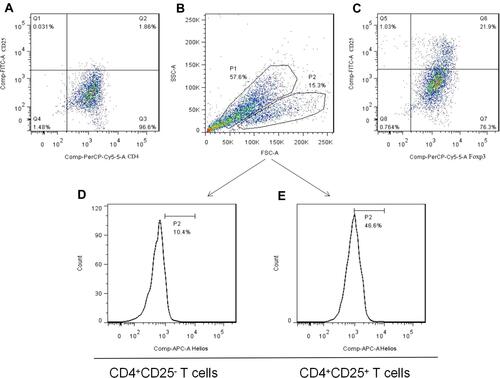
Figure 5 The effects of IRF4 on the function of induced Tregs. (A–C) The level of Helios and RORγt protein expression in induced CD4+CD25+Foxp3+ Tregs transfected with negative controls (Helios: 78.5%, RORγt: 0.209%). (D–F) The level of Helios and RORγt protein expression in induced CD4+CD25+Foxp3+ Tregs transfected with IRF4 control (Helios: 73.4%, RORγt: 0.200%). (G–I) The level of Helios and RORγt protein expression in induced CD4+CD25+Foxp3+ Tregs transfected with enhanced IRF4 (Helios: 47.0%, RORγt: 2.13%). (J–L) The level of Helios and RORγt protein expression in induced CD4+CD25+Foxp3+ Tregs transfected with an IRF4 inhibitor (Helios: 89.5%, RORγt: 0.00%). (M–O) The level of Helios and RORγt protein expression in induced CD4+CD25+Foxp3+ Tregs transfected with enhanced IRF4 and Helios over-expression (Helios: 63.1%, RORγt: 0.00%).
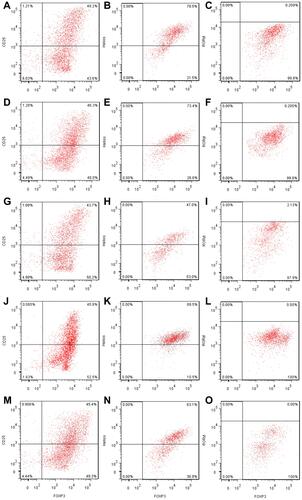
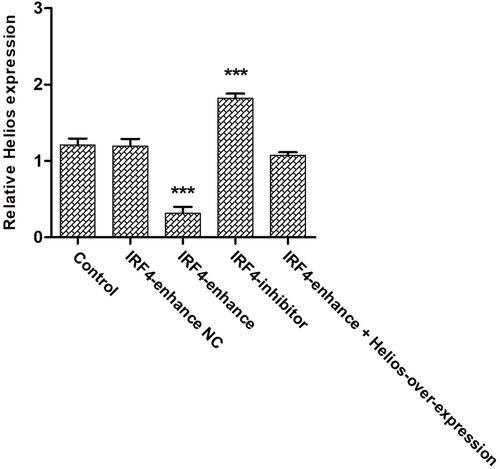
Figure 6 The level Helios expression in induced Tregs after IRF4 interference. The cumulative data showing the relative level of Helios mRNA expression in induced Tregs treated with enhanced IRF4, an IRF4 inhibitor, and respective negative controls. ***P < 0.001.