Figures & data
Figure 1 WGCNA of the OSA dataset (GSE135917). (A) The sample clustering results. (B) The sample dendrogram and trait heatmaps. (C) A soft threshold of 18 was the most suitable value to OSA. (D) Sixteen modules were related to OSA. (E) The corresponding heatmaps of module-trait relationships. (F) The Zsummary scores of 16 modules calculated by module preservation.
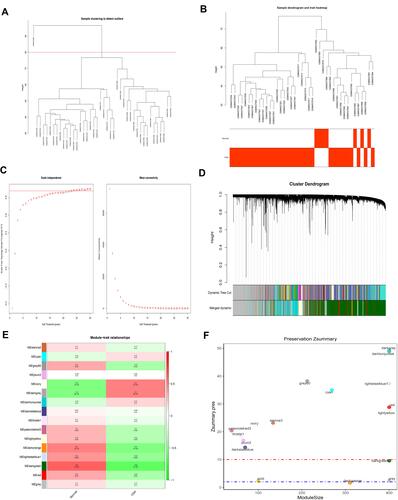
Figure 2 WGCNA of lung cancer dataset in The Cancer Genome Atlas (TCGA). (A) The sample clustering results. (B) The sample dendrogram and trait heatmaps. (C) A soft threshold of five was the most suitable value to lung cancer. (D) Thirty-five modules were related to lung cancer. (E) The corresponding heatmaps of module-trait relationships. (F) The Zsummary scores of 35 modules calculated by module preservation.
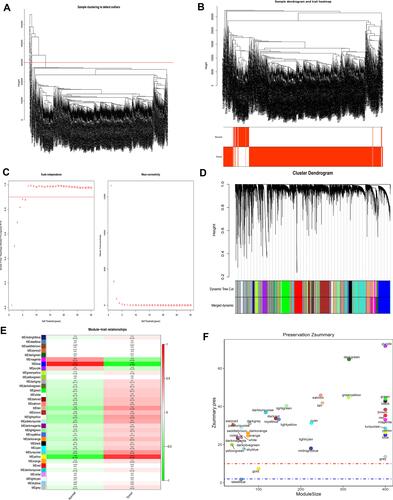
Figure 3 Screening for key modules and common genes. (A) Dark gray and ivory modules were screened in OSA and (B) blue and yellow modules were screened in lung cancer. (C) A total of 104 overlapped common genes in key modules of OSA and lung cancer were screened. (D) Gene Ontology analysis of 104 common genes in OSA and lung cancer.
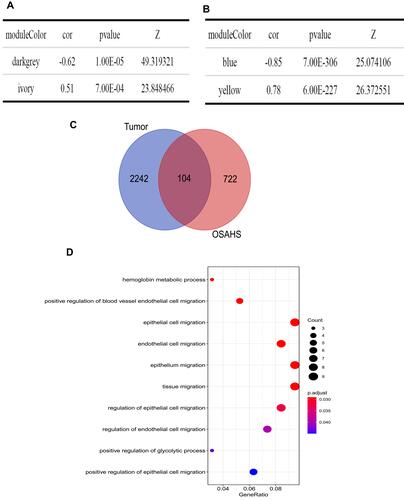
Table 1 Functional Enrichment Analysis and the Identified 10 Enriched Pathways
Figure 4 Identification of key genes associated with prognosis of lung cancer. (A) Fourteen genes and (B) four genes were related to prognosis by univariate Cox regression algorithm analysis and multivariate Cox regression algorithm analysis, respectively. The expressions of MOAP1, CBX7, PDGFB, and MAP2K3 were downregulated in both The Cancer Genome Atlas (TCGA) dataset (C) and the GSE30219 lung cancer samples (D). P values less than 0.05 are considered significant.
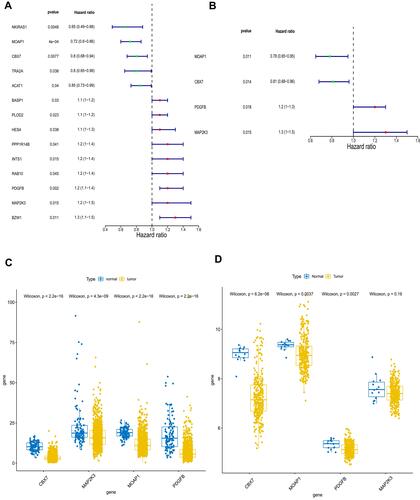
Table 2 The Coefficients of 4 Key Prognostic Genes
Figure 5 The prognostic assessment of the signature in The Cancer Genome Atlas (TCGA) dataset. (A) Survival status and survival duration of patients and heatmap of the four key prognostic genes expression in patients with lung cancer. (B) The risk score distribution of patients with lung cancer in TCGA dataset. (C) The Kaplan–Meier curve of the overall survival between the high-risk and low-risk groups stratified by the median risk score in TCGA dataset. (D) ROC analysis of the predictive efficiency of the four-gene prognostic model on overall survival based on risk score.
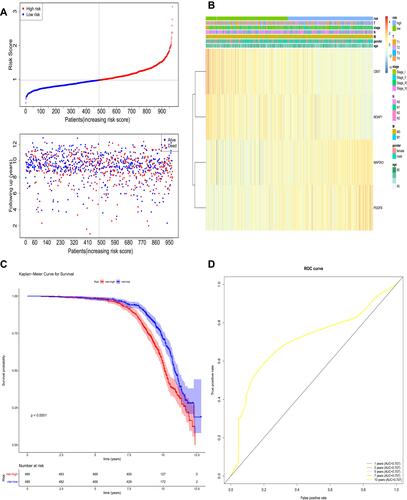
Figure 6 The prognostic assessment of the signature in the GSE30219 dataset. (A) Survival status and survival duration of patients and heatmap of the four key prognostic genes expression in patients with lung cancer. (B) The risk score distribution of patients with lung cancer in the GSE30219 dataset. (C) The Kaplan–Meier curve of the overall survival between the high-risk and low-risk groups stratified by the median risk score in the GSE30219 dataset. (D) ROC analysis of the predictive efficiency of the four-gene prognostic model on overall survival based on risk score.
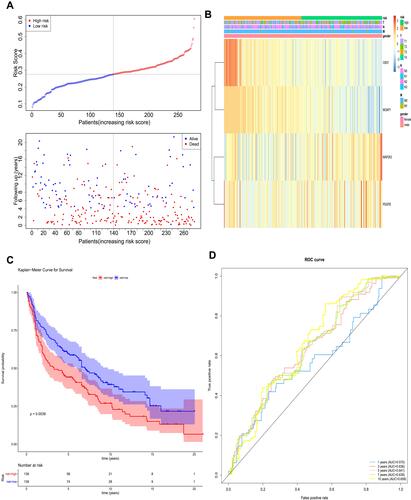
Figure 7 Univariate and multivariate analyses in The Cancer Genome Atlas (TCGA) training set and the GSE30219 validation set. (A) Univariate analysis in TCGA training set. (B) Multivariate analysis in TCGA training set. (C) Univariate analysis in the GSE30219 validation set. (D) Multivariate analysis in the GSE30219 validation set. P values less than 0.05 are considered significant.
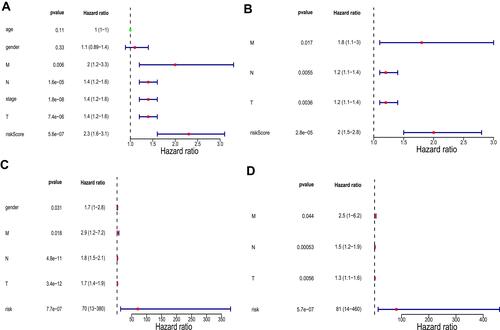
Figure 8 Validation of the nomogram in predicting overall survival of lung cancer in The Cancer Genome Atlas (TCGA) training set and the GSE30219 validation set. (A and C) A nomogram to predict survival probability at the 1-, 3-, 5-, 7-, and 10-year timepoints for patients with lung cancer on the basis of results derived from TCGA training and GSE30219 validation sets. (B and D) Calibration curve for the nomogram when predicting the 1-, 3-, 5-, 7-, and 10-year overall survival in TCGA training and GSE30219 validation sets.
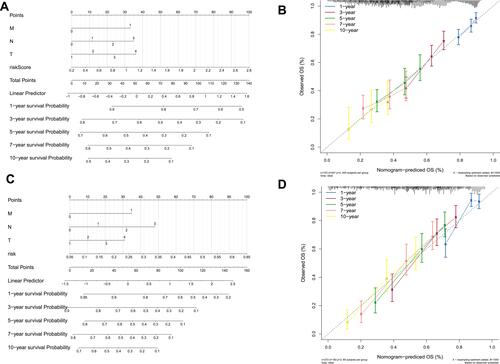
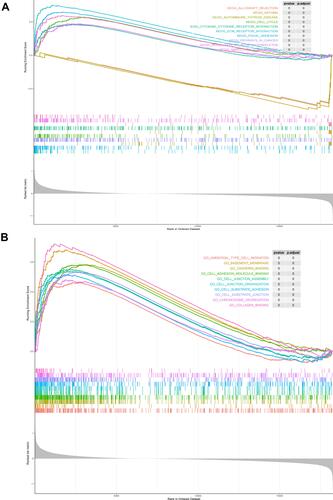
Figure 9 Gene set enrichment analysis between the high- and low-risk groups. (A) The top 10 Kyoto Encyclopedia of Genes and Genomes (KEGG) pathways. (B) The top 10 Gene Ontology (GO) terms.