Figures & data
Table 1 Patient Baseline Demographic and Clinical Characteristics
Figure 1 Flowchart of patient selection.
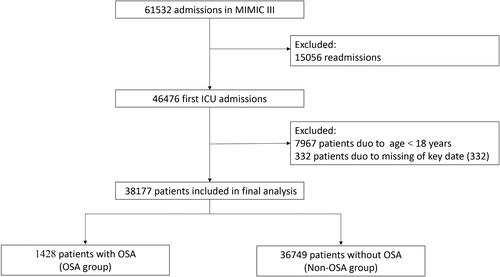
Table 2 Propensity Score-Matched Patients with and without OSA
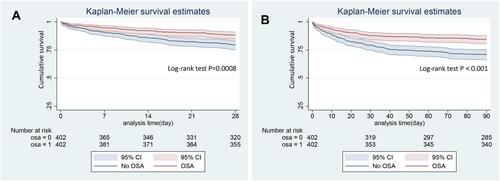
Figure 2 Kaplan-Meier curve (and 95% confidence limits) depicts predicted overall survival between OSA and No OSA groups. (A) 28-day follow up; (B) 90-day follow up.