97
Views
2
CrossRef citations to date
0
Altmetric
Original Research

The Value of Three-Dimensional Speckle-Tracking Echocardiography in the Prediction of Cardiovascular Events in Patients with Hypertension Complicated by Acute Myocardial Infarction: A Long-Term Follow-Up Study

, , &
Pages 6703-6712 | Published online: 12 Oct 2021

Figures & data

Figure 1 Kaplan–Meier survival analysis curve for patients with hypertension accompanied by AMI. The follow-up time was (41.27±20.45) months, and 20 patients had recurrent cardiovascular events during the follow-up period.

Figure 1 Kaplan–Meier survival analysis curve for patients with hypertension accompanied by AMI. The follow-up time was (41.27±20.45) months, and 20 patients had recurrent cardiovascular events during the follow-up period.

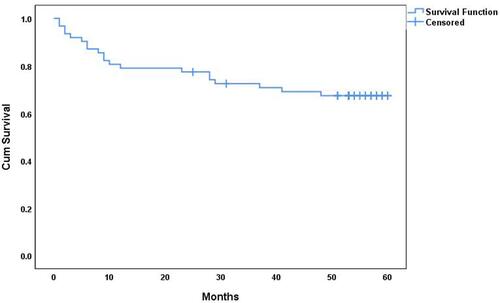
Table 1 Demographic and Clinical Characteristics of Patients in Group NCE and Group RCE

Table 2 Echocardiographic Parameters of Patients in Group NCE and Group RCE

Figure 2 Comparison of 3D strain parameters in patients with hypertension accompanied by AMI during follow-up. Group NCE patients without recurrent cardiovascular event, Group RCE patients with recurrent cardiovascular event; *p value < 0.05 versus Initial echocardiographic findings or one week after PCI.

Abbreviations: LV, left ventricle; PCI, percutaneous coronary intervention; 3D-GLS, 3D Global longitudinal strain; 3D-GCS, 3D Global circumferential strain; 3D-GAS, 3D Global radial strain; 3D-GAS, 3D Global area strain.
Figure 2 Comparison of 3D strain parameters in patients with hypertension accompanied by AMI during follow-up. Group NCE patients without recurrent cardiovascular event, Group RCE patients with recurrent cardiovascular event; *p value < 0.05 versus Initial echocardiographic findings or one week after PCI.

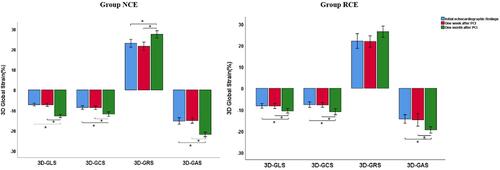
Table 3 Univariate and Multivariate Cox Risk Regression Models to Analyze Risk Factors for Recurring Cardiovascular Events in Patients with Hypertension Accompanied by AMI

Figure 3 ROC curves of 3D Global longitudinal strain, 3D Global area strain for predicting recurrent cardiovascular events in patients with hypertension accompanied by AMI.

Figure 3 ROC curves of 3D Global longitudinal strain, 3D Global area strain for predicting recurrent cardiovascular events in patients with hypertension accompanied by AMI.

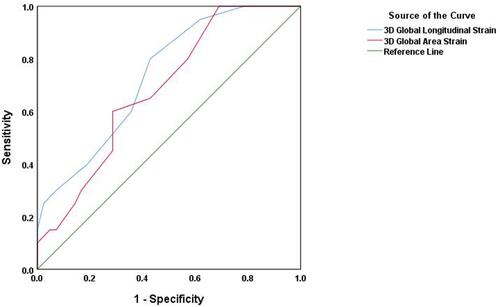
Table 4 Intar-Observer and Inter-Observer Variability of 3D Strain Parameters (n = 22)