
Figures & data
Table 1 Clinical Characteristics of the Study Population
Table 2 Performance of NT for Detecting All Karyotype Aneuploidies
Figure 1 Effectiveness of screening for chromosomal aberrations using different cutoff values for fetal nuchal translucency (NT). ROC curve of NT: NT ≥2.5 mm: area under the curve (AUC) = 0.619, 95% confidence interval (CI) = 0.571–0.667, P < 0.0001. NT ≥95th: AUC = 0.624, 95% CI = 0.575–0.672, P < 0.0001. NT ≥99th: AUC = 0.610, 95% CI = 0.560–0.660, P < 0.0001. NT ≥3.0 mm: AUC = 0.616, 95% CI = 0.566–0.666, P < 0.0001. NT ≥3.5 mm: AUC = 0.599, 95% CI = 0.548–0.651, P < 0.0001.
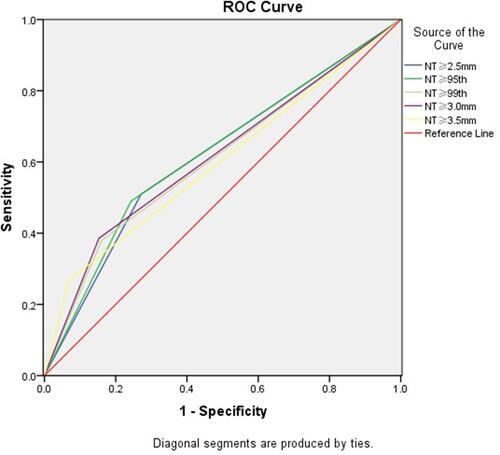
Table 3 Performance of NT for Detection of Trisomy 21
Figure 2 Effectiveness of screening for trisomy 21 using diffident cutoff values of fetal nuchal translucency (NT). ROC curve of NT: NT ≥2.5 mm: area under the curve (AUC) = 0.692, 95% confidence interval (CI) = 0.630–0.755, P < 0.0001. NT ≥95th: AUC = 0.700, 95% CI = 0.637–0.755, P < 0.0001. NT ≥ 99th: AUC = 0.682, 95% CI = 0.614–0.751, P < 0.0001. NT ≥3.0 mm: AUC = 0.679, 95% CI = 0.610–0.748, P < 0.0001. NT ≥3.5 mm: AUC = 0.642, 95% CI = 0.569–0.714, P < 0.0001.
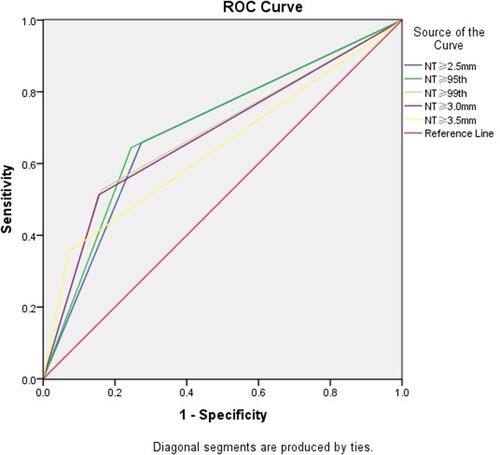
Table 4 Criteria of Increased NT in Different Countries