
Figures & data
Table 1 Characteristics of the Participants
Table 2 Pearson Correlation Coefficients of the General Medicine in-Training Examination and Professional and Linguistic Assessments Board 1 Examination Scores
Figure 1 Scatter plot of the General Medicine In-training Examination (GM-ITE) and Professional and Linguistic Assessments Board (PLAB) 1 examination scores. The vertical axis is the PLAB 1 examination score, and the horizontal axis is the GM-ITE score.
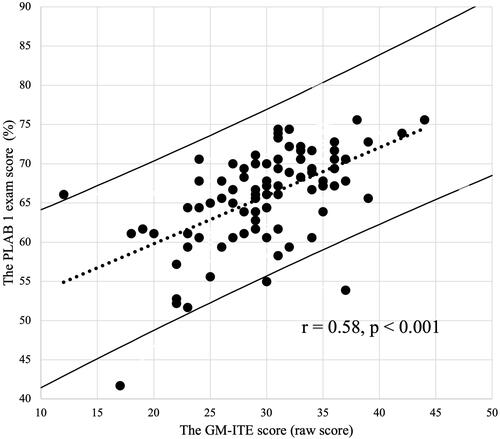
Figure 2 Discrimination indexes of the examination scores of the General Medicine In-training Examination (GM-ITE; A) and Professional and Linguistic Assessments Board 1 (PLAB; B). In both figures, the horizontal axis is the discrimination indices (DI), and the vertical axis is the proportion of questions within a certain DI range in the total questions. The figure with black bars shows the DI of GM-ITE, and the figure with shaded bars shows that of PLAB examination.
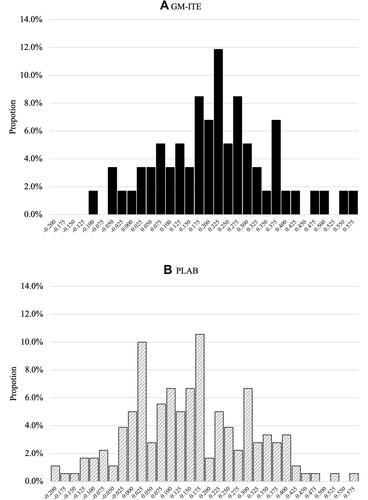
Table 3 Development Process of the General Medicine in-Training Examination