Figures & data
Figure 1 Selection of lncRNA using Lasso regression. (A) Lasso coefficient of the five included lncRNAs. (B) Profiles of Lasso coefficients. (C) Univariate analysis of included lncRNAs from the samples. Abbreviations: *P<0.05; **P<0.01.
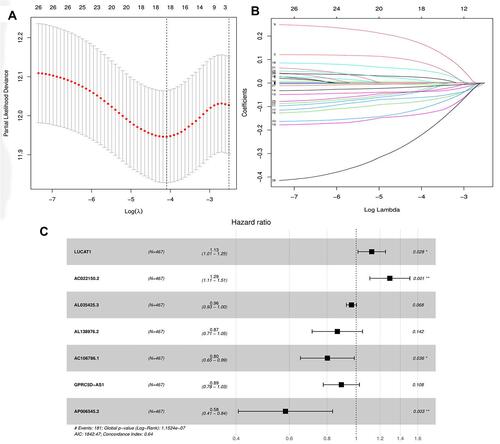
Table 1 Survival Analysis of the Seven lncRNAs Obtained Using TCGA-LUSC Data
Table 2 Correlation Coefficients of Genes Associated with the Seven lncRNAs Obtained Using TCGA-LUSC Data
Figure 2 The Kaplan-Meier survival analysis of seven included lncRNAs. LUCAT1, AC022150.2, AL035425.3, AL138976.2, AC106786.1, GPRC5D-AS1 and AP006545.2 were independent protective factors for lung squamous carcinoma. (A) Survival analysis of AC022150.2 in LUSC patients; (B) survival analysis of AC106786.1 in LUSC patients; (C) survival analysis of AL035425.3 in LUSC patients; (D) survival analysis of AL138976.2 in LUSC patients; (E) survival analysis of AP006545.2 in LUSC patients; (F) survival analysis of GPRC5D-AS1 in LUSC patients; (G) survival analysis of LUCAT1 in LUSC patients.
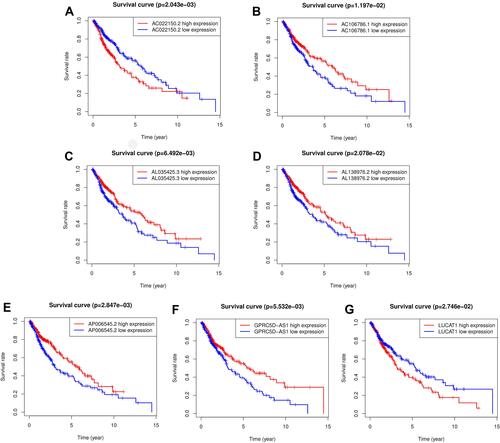
Figure 3 The co-expression network of autophagy-related lncRNA-mRNA and Sankey diagram. (A) mRNA–autophagy-related lncRNAs–risk type relationship showed in Sankey diagram. (B) The co-expression network visualized using Cytoscape 3.7.2 software.
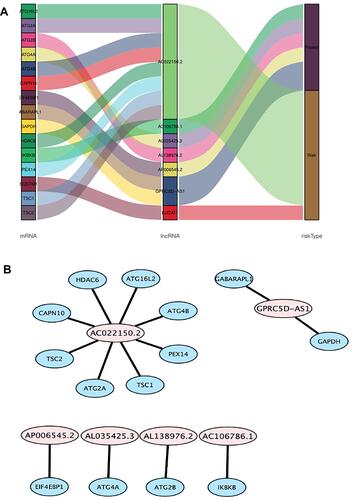
Figure 4 The prognostic indicators of the five autophagy-related lncRNAs signature. (A) 1-year survival ROC curve for LUSC patients. (B) 3-year survival ROC curve for LUSC patients. (C) 5-year survival ROC curve for LUSC patients. (D) 7-year survival ROC curve for LUSC patients. (E) Kaplan-Meier survival curve of the high-risk and low-risk groups for LUSC patients.
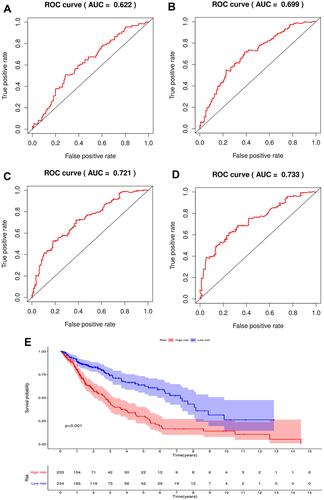
Figure 5 The analysis of the risk score from the generated risk model. (A) Expression profiles of lncRNAs in high and low risk groups; (B) the risk curve of each sample in high and low risk group; (C) the survival plot of each sample based on the risk score.
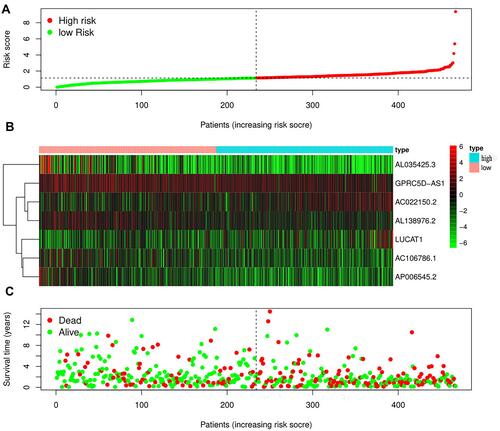
Table 3 Univariate Cox Regression Analysis to Identify a Correlation Between the Clinicopathological Characteristics and Risk Scores
Table 4 Multivariate Cox Regression Analysis to Identify a Correlation Between Clinicopathological Characteristics and Risk Scores
Table 5 Relationship Between Clinicopathological Characteristics and Risk Score
Figure 6 The evaluation of the constructed signature’s prognostic credibility in LUSC patients. (A and B) The univariate and multivariate Cox regression analysis of risk score and clinicopathological characteristics. (C) The integrated ROC curves of risk score and clinical features.
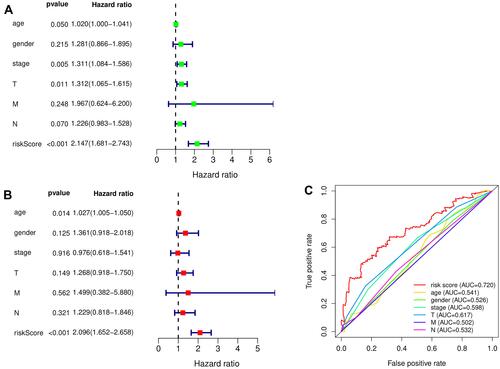
Figure 7 Nomogram prediction model in LUSC patients. (A) The nomogram of 1-year, 3-year or 5-year survival predictability based on risk score, age and TNM stage. (B–D) The calibration plots for predicting 1-year, 3-year or 5-year survival.
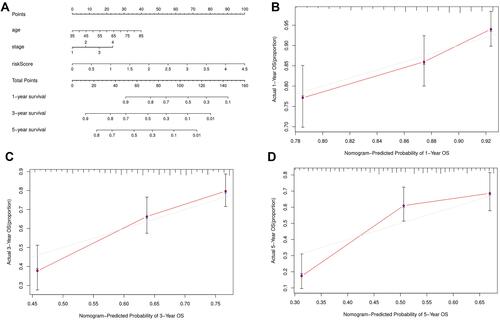
Figure 8 Drug sensitivity analysis between high-risk and low-risk group. (A) The IC50 of Cisplatin between the two groups; (B) The IC50 of Docetaxel between the two groups; (C) The IC50 of Gemcitabine between the two groups; (D) The IC50 of Paclitaxel between the two groups; (E) The IC50 of Vinblastine between the two groups; (F) The IC50 of Vinorelbine between the two groups. **P<0.01; ***P<0.001.
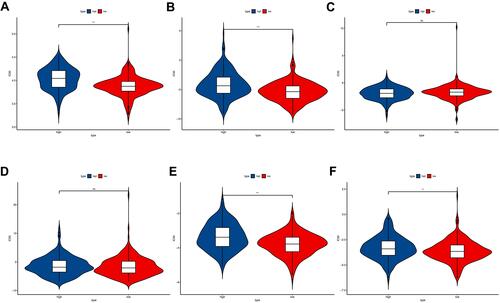
Figure 9 The functional enrichment analysis based on autophagy-related lncRNAs. (A and B) Upregulated KEGG pathway in high risk group and low risk group; (C and D) Upregulated Gene Ontology terms in high risk group and low risk group.
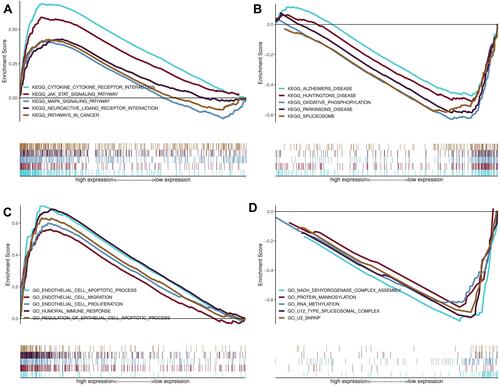
Figure 10 Validation of IKBKB-AC106786.1 and SQSTM1-LUCAT1 in GEPIA database. (A) The mRNA expression levels of AC106786.1; (B) The mRNA expression levels of IKBKB; (C) The mRNA expression levels of LUCAT1; (D) The mRNA expression levels of SQSTM1; (E) Kaplan-Meier survival analysis of AC106786.1; (F) Kaplan-Meier survival analysis of IKBKB; (G) Kaplan-Meier survival analysis of LUCAT1; (H) Kaplan-Meier survival analysis of SQSTM1.
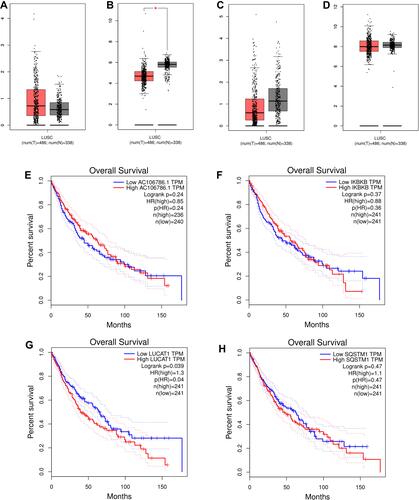
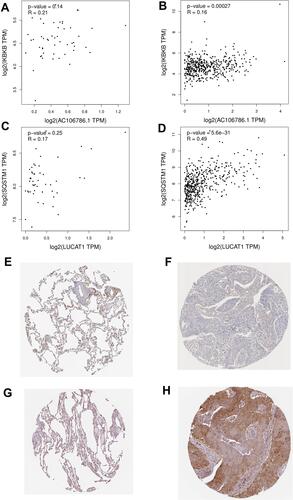
Figure 11 Correlation test in GEPIA and protein expression in HPA. (A) Spearman correlation tests for IKBKB-AC106786.1 in tumor sample; (B) Spearman correlation tests for IKBKB-AC106786.1 in normal lung sample; (C) Spearman correlation tests for SQSTM1-LUCAT1 in tumor sample; (D) Spearman correlation tests for SQSTM1-LUCAT1 in normal lung sample; (E) the expression level of IKBKB in normal lung sample; (F) the expression level of IKBKB in tumor sample; (G) the expression level of SQSTM1 in normal lung sample; (H) the expression level of SQSTM1 in tumor sample.