Figures & data
Figure 1 The ultrasonic imagings of FA and FTC. (A) Ultrasonic imaging of FA. The image showed an elliptic isoechoic nodule with smooth margins, thin and even peripheral halo, and accompanied by cystic changes. (B) Ultrasonic imaging of FTC. It resembled a large oval nodule that was subdivided into smaller nodules by the hypoechoic region, which was known as the “separated nodules sign” in this study. (C) Ultrasonic imaging of FTC. The image showed an elliptic isoechoic nodule with a discontinuous and irregular thick halo. Two white arrows indicated the discontinuous change of peripheral halo. (D) Ultrasonic imaging of FTC. The image showed an elliptic isoechoic nodule with irregular margins. Two white arrows indicated local irregular change.
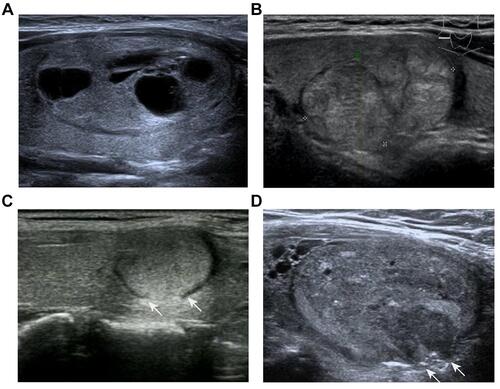
Table 1 Clinical and Ultrasonic Features of the Nodules
Table 2 Clinical and Ultrasonic Features Included in Multivariate Logistic Regression Analysis
Figure 2 Clinical and ultrasonic characteristics were screened by LASSO regression analysis. (A) Optimization parameters (lambda) of the LASSO model were obtained via 10-fold cross-validation. Dotted vertical lines were drawn at the optimal values based on the minimum criteria and the one standard error of the minimum criteria (B) The LASSO coefficient profiles of the 13 features. A coefficient profile plot was produced against the log(lambda) sequence.
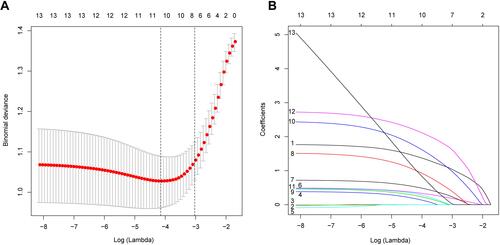
Figure 3 Development of ultrasonic diagnostic nomogram. The first number line represents the score range (0–100) for the variable. Number lines 2 to 11 are the 10 clinical and ultrasonic features included, each of which has a corresponding score found on the first number line. The sum of the scores of all features is the total score of each patient, and the total score of each patient can be found on the 12th number line. The 13th number line represents the probability of being diagnosed with FTC.
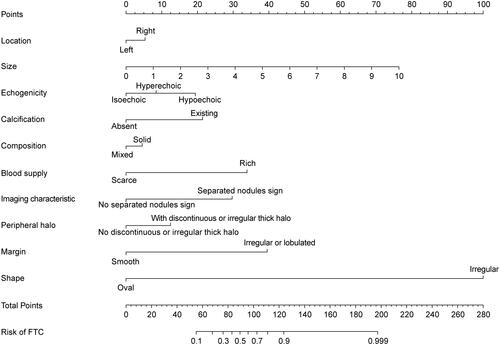
Figure 4 Evaluation of the accuracy of the ultrasonic diagnostic model. (A) ROC was used to evaluate the predictive power of ultrasound diagnostic models. The AUC was 0.860. The optimal cut-off value for the patient total score was 71.8. (B) The calibration curves of the ultrasonic diagnostic model for FTC. The higher the coincidence degree between the blue line and diagonal line, the better the accuracy of the model.
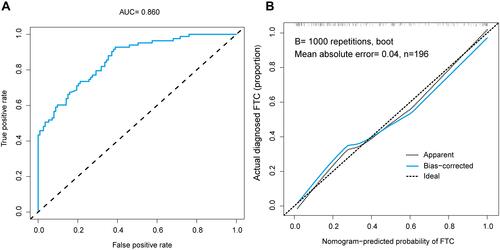
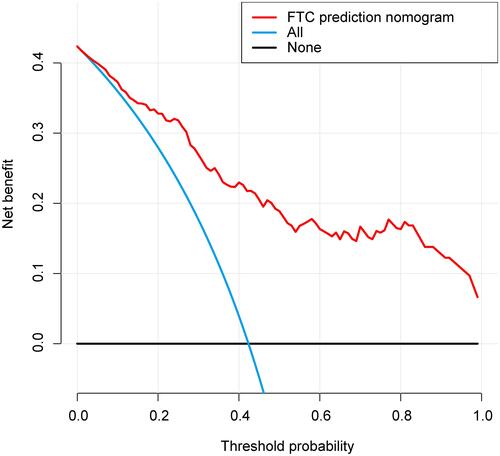
Figure 5 Decision curve analysis for the ultrasonic diagnostic model. The red line represents the ultrasound diagnostic model. When the threshold probability is greater than 3%, the model has a relatively good net benefit.