Figures & data
Table 1 Sample Grouping Schedule of Healthy Subjects and TBE Patients Enrolled in This Study
Figure 1 Chromatograms representing serum metabolic fingerprints of TBE patient samples and control samples obtained with LC-MS in positive ionization mode on reverse C18 column. (A) TBE patient sample; (B) control sample.
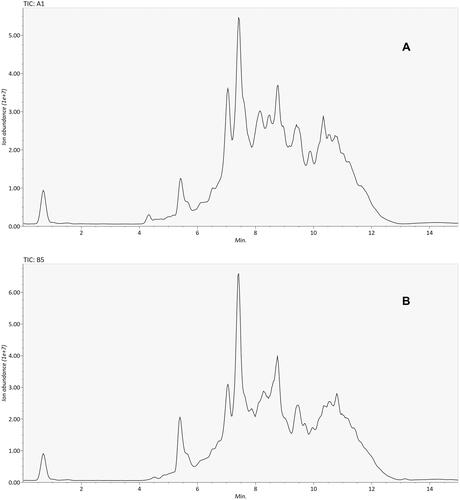
Figure 2 PCA models built on metabolomics data obtained with LC-ESI-MS analysis in positive mode (PC1=32.6%, PC2=14.4%). Red, green and blue solid circles correspond to control, QC and TBE samples respectively.
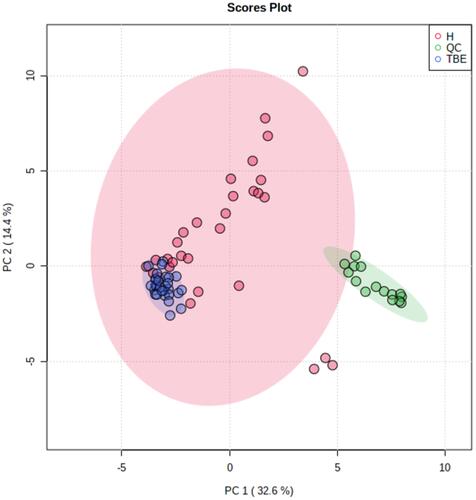
Figure 3 (A) OPLS models based on metabolomics data obtained with LC-ESI-MS analysis in positive mode on reverse C18 column. Red and jade-green solid circles correspond to TBE and control samples respectively. (B) 200-time permutation test was used to validate the corresponding model.
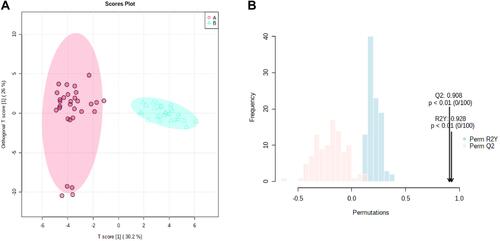
Table 2 Identified Metabolites of TBE Serum from LC-MS Analysis Based on Reverse C18 Column in Positive Mode
Figure 4 Significant metabolites that distinguish TBE patients from control group. Two-way hierarchical cluster analysis (HCA) using C18 chromatography shows clusters of metabolites from human serum and illustrates the patterns distinguishing those with TBE from control group (A: shown in TBE patient sample; B: shown in control group).
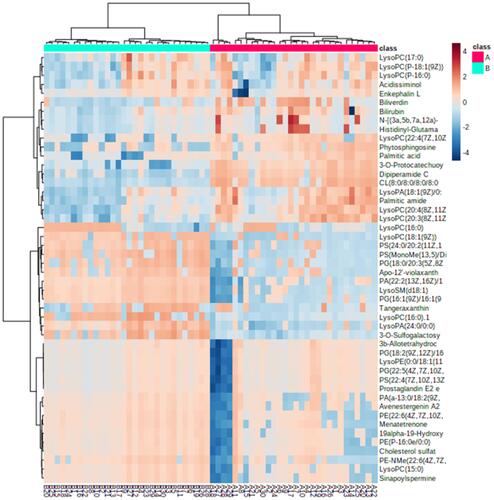
Figure 5 Graphic representation of the pathway analysis of significantly altered metabolites. (A: Glycerophospholipid metabolism; B: sphingolipid metabolism; C: glycerolipid metabolism; D: phosphatidylinositol signaling system; E: biosynthesis of unsaturated fatty acids; F: fatty acid elongation).
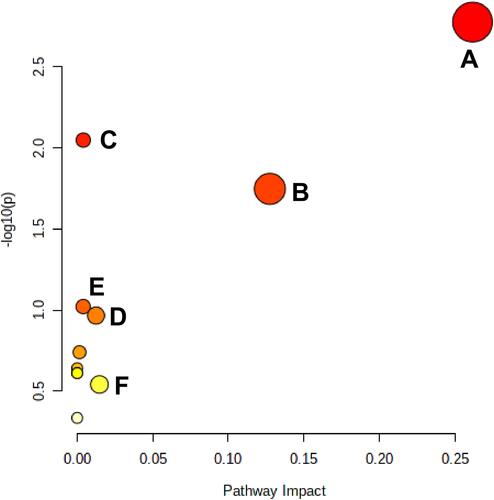
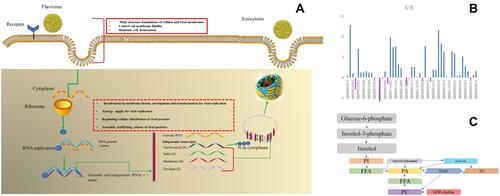
Figure 6 (A) Diagram of illustrating of the cycle of flavivirus and potential lipid modifications that enrolled in inhibition viral entry, membrane fusion, and viral replications. (B) Abundances analysis of the potential biomarkers in TBE patients compared to control group. (C) Major altered lipid pathways in TBE patients.