Figures & data
Figure 1 Flow chart of identifying the study population from the National Health Insurance Service-Health Screening Cohort database of the Republic of Korea.
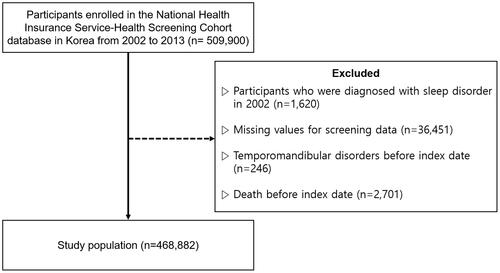
Table 1 Demographic and Clinical Characteristics of the Study Population According to the Presence of Primary Sleep Disorders
Figure 2 Kaplan–Meier survival curve for log survival probability according to primary sleep disorder on new events of temporomandibular disorders over 8 years follow-up.
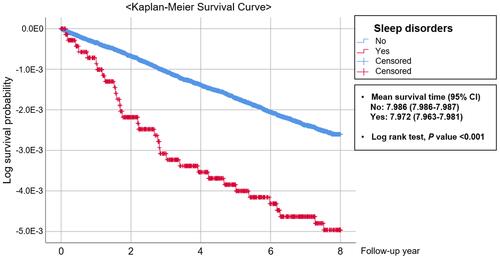
Table 2 Hazard Ratios for Temporomandibular Disorders According to the Presence of Primary Sleep Disorders
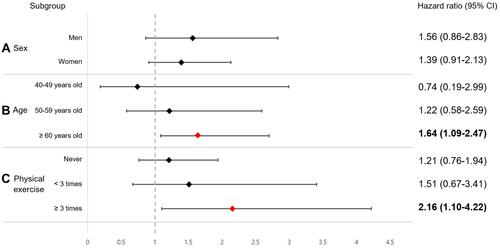
Figure 3 Subgroup analysis of the association between primary sleep disorders and temporomandibular disorders by sex (A), age (B), and physical exercise (C). Bold indicates P < 0.05.