Figures & data
Table 1 Clinicopathological Characteristics of All Patients
Figure 1 Selection of informative factors associated with OS and CSS using the LASSO Cox regression model. (A) LASSO coefficient profiles of all clinical features for OS. (B) Selection of the tuning parameter (λ) for OS. (C) LASSO coefficient profiles of all clinical features for CSS. (D) Selection of the tuning parameter (λ) for CSS.
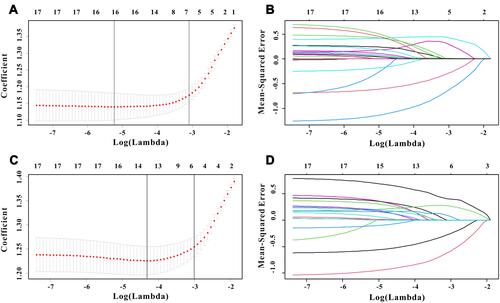
Figure 2 Survival nomogram for the prediction of 3-year, 5-year and 10-year OS (A) and CSS (B) in elderly osteosarcoma patients.
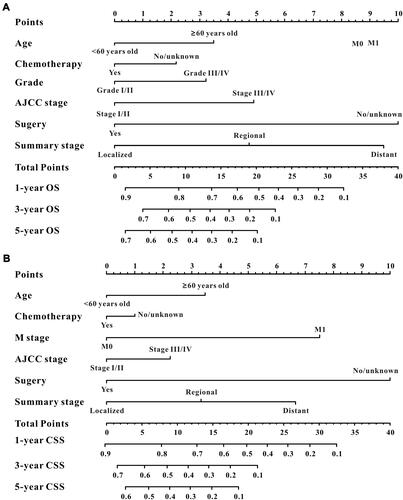
Figure 3 The calibration curves for predicting OS and CSS in the training and validation sets. Calibration plots of 1-year, 3-year and 5-year OS in the training cohort (A–C) and in the SEER validation cohort (D–F). Calibration plots of 1-year, 3-year and 5-year CSS in the training cohort (G–I) and in the SEER validation cohort (J–L).
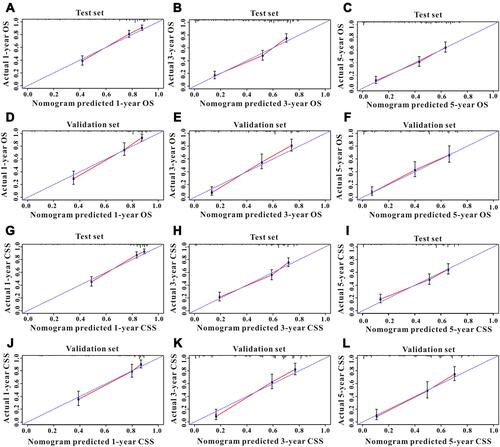
Figure 4 Predictive performance of the survival nomogram reflected by td-ROC curves. td-ROC curves for the 1-year, 3-year and 5-year OS in patients in the training cohort (A) and in the validation cohort (B). td-ROC curves for the 1-year, 3-year and 5-year CSSS in patients in the training cohort (C) and in the validation cohort (D).
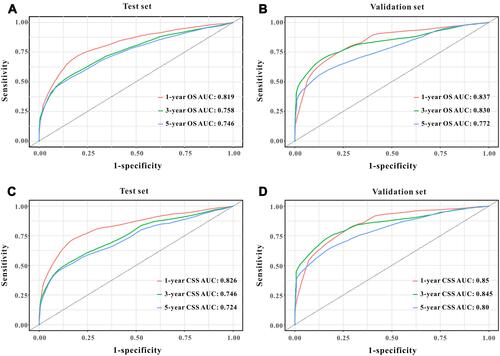
Figure 5 Decision curves analysis (DCA) for the survival nomogram to assess its clinical usefulness. The DCA of survival nomogram for OS in the training (A) and in the validation sets (B). The DCA of survival nomogram for CSS in the training (C) and in the validation sets (D).
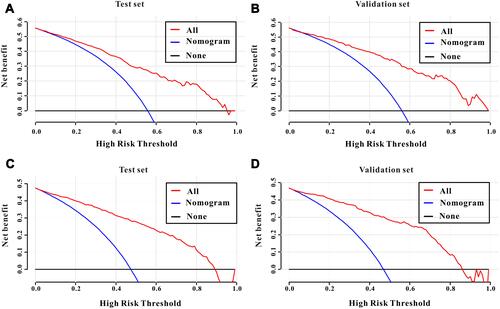
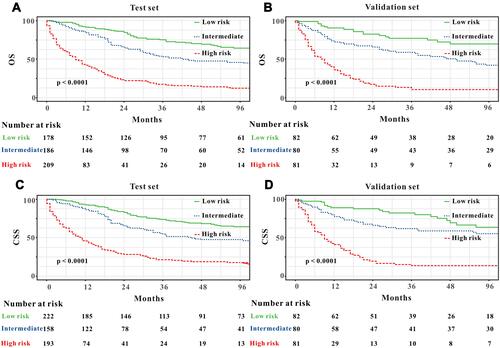
Figure 6 Analysis of the prognostic significance of the nomogram in elderly osteosarcoma patients. Kaplan–Meier curves of OS for all patients stratified by the tertiles points predicted by the nomograms in training cohort (A) and in the validation set (B). Kaplan–Meier curves of CSS for all patients stratified by the tertiles points predicted by the nomograms in training cohort (C) and in the validation set (D).