Figures & data
Figure 1 FTO was abnormally expressed in human pan-cancer. (A) FTO expression levels in 31 normal tissues from the GTEx database. (B) FTO expression levels in 21 tumor cells from the CCLE database. (C) Differential expression levels of FTO in 20 tumors and paired adjacent noncancerous tissues from TCGA database. (D) FTO expression difference in 27 cancer types integrated from the GTEx database and TCGA database. (*P < 0.05, **P < 0.01, ***P < 0.001).
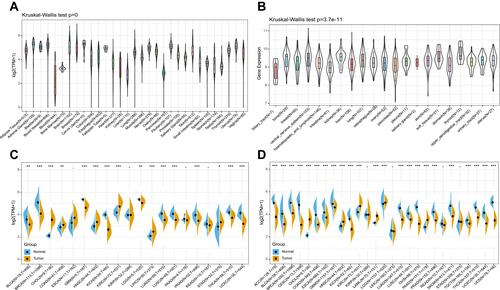
Figure 2 Forest plots of hazard ratios of FTO. (A) The forest plot of the relationship between FTO expression and OS across 33 tumors. (B) The forest plot of the relationship between FTO expression and DFI across 33 tumors. (C) The forest plot of the relationship between FTO expression and DSS across 33 tumors. (D) The forest plot of the relationship between FTO expression and PFI across 33 tumors.
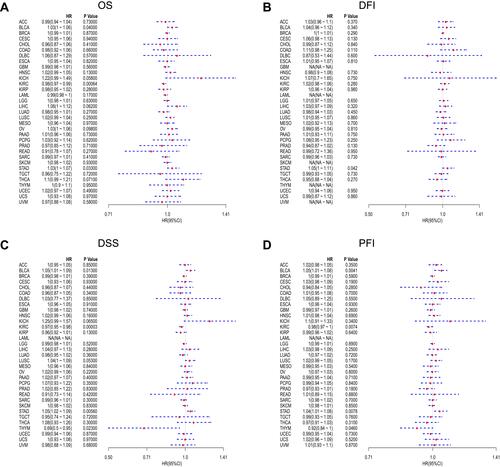
Figure 3 Relationship of FTO expression with patients’ prognosis. (A–C) Kaplan–Meier OS curves of FTO expression in BLCA, KIRC, and STAD. (D) The Kaplan–Meier DFI curve of FTO expression in STAD. (E–H) Kaplan–Meier DSS curves of FTO expression in BLCA, KIRC, STAD, and THYM. (I–L) Kaplan–Meier PFI curves of FTO expression in BLCA, KIRC, STAD, and THYM.
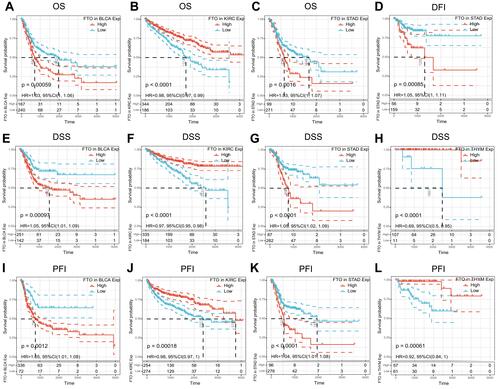
Figure 4 Correlation analysis between FTO expression and immune cell infiltration, stromal score, and immune checkpoint genes across cancers. (A) FTO expression positively correlates with immune infiltrating cells in COAD, KIRC, and LIHC. (B) FTO expression positively correlates with stromal score in COAD, PAAD, and STAD. (C) Correlation analysis between the expression of FTO and 47 immune checkpoint genes across cancers. (*P < 0.05, **P < 0.01, ***P < 0.001).
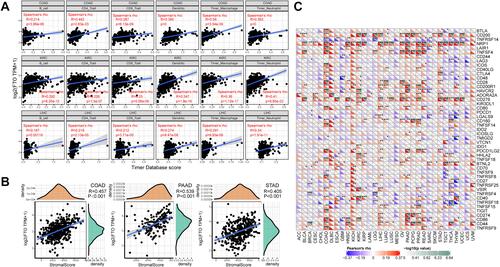
Figure 5 Correlation analysis between FTO expression and MMR gene mutation levels and methyltransferases expression in pan-cancer. (A) Spearman correlation analysis of FTO expression with the expression of five MMR genes in pan-cancer. (B) Spearman correlation analysis of FTO expression with the expression of four methyltransferases in pan-cancer. Red represents DNMT1, blue represents DNMT2, green represents DNMT3A, and purple represents DNMT3B. (*P < 0.05, **P < 0.01, ***P < 0.001).
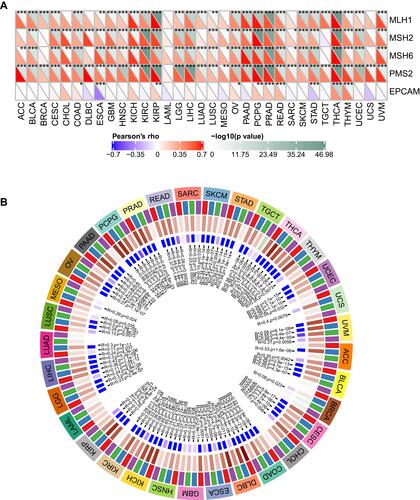
Figure 6 Correlations of FTO expression with TMB and MSI in pan-cancer. (A) The correlation analysis between FTO expression and TMB in pan-cancer. (B) The correlation analysis between FTO expression and MSI in pan-cancer.
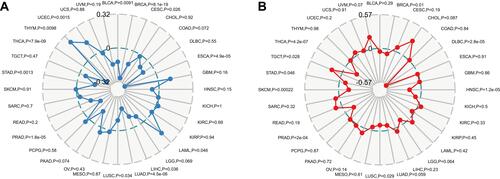
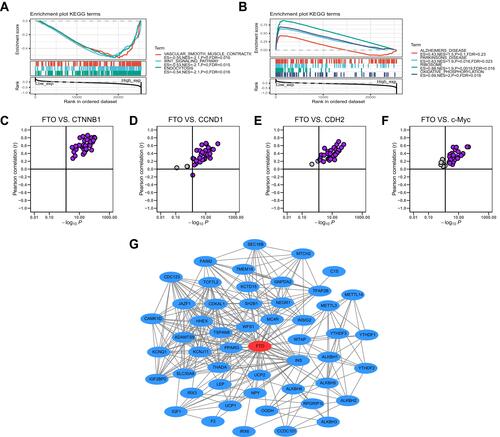
Figure 7 Gene set enrichment, correlation and PPI network analysis of FTO in pan-cancer. (A) The top 3 signaling pathways were enriched in the high FTO expression group in KEGG database. (B) The top 4 signaling pathways were enriched in the low FTO expression group in KEGG database. (C–F) FTO was positively associated with CTNNB1, CCND1, CDH2, and c-Myc in almost all cancers based on TCGA database. (G) PPI network view from STRING website showed the interaction network of FTO.