Figures & data
Table 1 Summary of Clinical Information Related to a Total of 56 Intestinal Segments in 29 Crohn’s Patients
Table 2 Summary of Different Virtual Single Energy CT Values, Slope K of Energy Spectrum Curve and Iodine Content in Diseased Intestine and Normal Intestine
Figure 1 A 27-year-old male patient with the main complaint of a change in the nature of his stools and abdominal pain for more than two years. CDAI = 80.1 (remission stage). (A and B) show the endoscopic manifestations: the pentagonal markers indicate white scars and triangular markers indicate pseudogranulomas. (C and D) show the virtual monoenergetic charts, in the arterial phase, of 40 keV and 100 keV, respectively; the CT values of the diseased intestinal segment (pink arrow) were 186.8 HU and 67.7 HU, respectively. (G and H) show the virtual monoenergetic charts, in the portal phase, of 40 keV and 100 eV, respectively; the CT values of the diseased intestinal segment (pink arrow) were 271.3 HU and 78 HU, respectively. (E and I) show the iodograms in the arterial and portal phase, respectively; the iodine contents of the diseased intestinal segment (pink arrow) were 2.1 mg/mL and 2.9 mg/mL, respectively. (F and J) show the arterial and portal energy-spectrum curves, respectively, with the diseased bowel segment at the top and the normal bowel segment at the bottom.
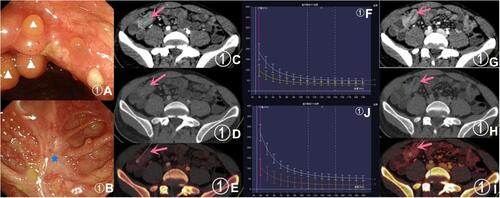
Table 3 Comparison of Different Virtual Single Energy CT Values, K and Iodine Contents in the Intestinal Wall Between the Remission Group and the Active Group
Figure 2 A 32-year-old male patient with the main complaint of recurrent abdominal pain for more than a year. CDAI = 380 (active stage). (A and B) show the endoscopic manifestations: the pentagonal markers indicate congestion and edema. (C and D) show the virtual monoenergetic charts, in the arterial phase, of 40 keV and 100 keV, respectively; the CT values of the diseased intestinal segment (pink arrow) were 303.5 HU and 67.1 HU, respectively. (G and H) show the virtual monoenergetic charts, in the portal phase, of 40 keV and 100 keV, respectively; the CT values of the diseased intestinal segment (pink arrow) were 314.5 HU and 73.1 HU, respectively. (E and I) show the iodograms in the arterial and portal phase, respectively; the iodine contents of the diseased intestinal segment (pink arrow) were 3.3 mg/mL and 3.6 mg/mL, respectively. (F and J) show the arterial and portal energy-spectrum curves, respectively, with the diseased bowel segment at the top and the normal bowel segment at the bottom.
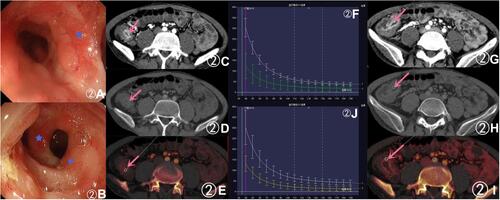
Table 4 The Value of Different Virtual Single Energy CT Values, K and Iodine Content in the Assessment of CD Activity in Arterial and Portal Phases
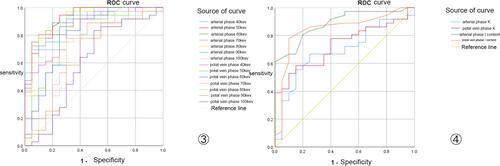
Figure 3 ③ and ④ show the ROC curves of the virtual monoenergetic CT values, slope of the energy-spectrum curve, and iodine content in the active stage and in the remission stage, respectively.