Figures & data
Figure 1 The flow chart of this study.
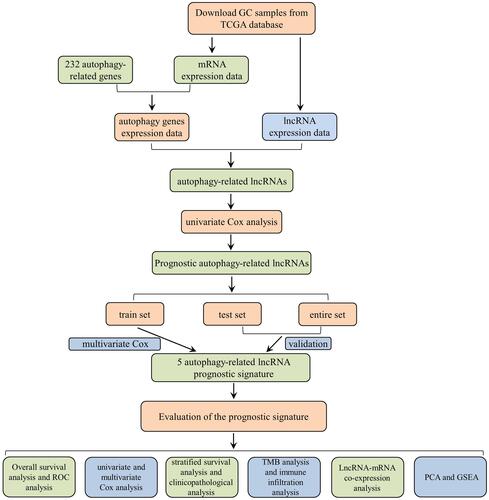
Table 1 The 5 Autophagy-Related lncRNA Prognostic Signature
Figure 2 Identification of autophagy-related lncRNAs with significant prognostic value in GC.
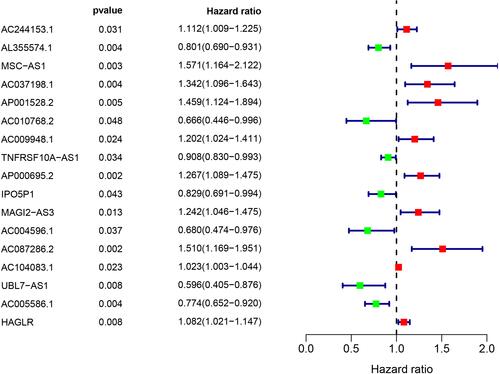
Figure 3 The prognostic value of the 5 autophagy-related lncRNAs signature in the train set. (A) The number of patients in the high-risk and low-risk groups ranked by the risk score. (B) The scatter dot plot of GC patients’ survival status. (C) The heatmap of the 5 autophagy-related lncRNAs expression. (D) Kaplan-Meier survival analysis for patients between the high-risk and low-risk groups. (E) The ROC for the autophagy-related lncRNAs signature.
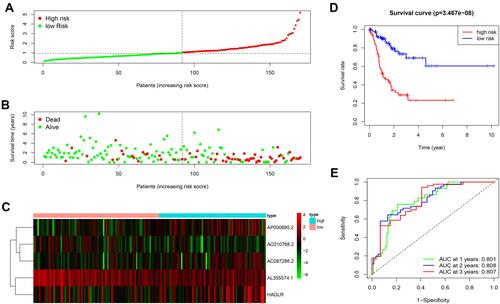
Figure 4 Prognostic analysis of the 5 autophagy-related lncRNAs signature in the test set and the entire set. (A) Distribution of the risk score in the test set. (B) Distribution of the risk score in the entire set. (C) The scatter dot plot of GC patients’ survival status in the test set. (D) The scatter dot plot of GC patients’ survival status in the entire set. (E) The heatmap of the 5 autophagy-related lncRNAs expression in the test set. (F) The heatmap of the 5 autophagy-related lncRNAs expression in the entire set. (G) Kaplan-Meier survival analysis for patients between the high-risk and low-risk groups in the test set. (H) The ROC for the autophagy-related lncRNAs signature in the test set. (I) Kaplan-Meier survival analysis for patients between the high-risk and low-risk groups in the entire set. (J) The ROC for the autophagy-related lncRNAs signature in the test set.
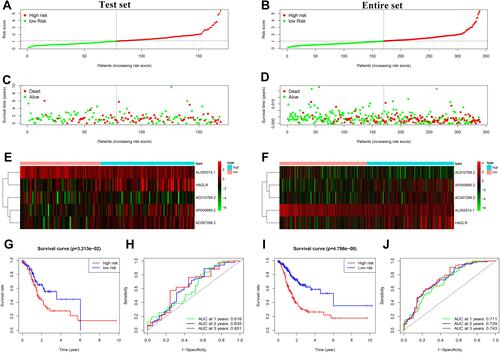
Figure 5 Independent prognostic value of the 5 autophagy-related lncRNAs prognostic signature. (A) The univariate Cox regression analysis of the 5 lncRNAs and clinicopathologic parameters in the train set. (B) The univariate Cox regression analysis of the 5 lncRNAs and clinicopathologic parameters in the test set. (C) The univariate Cox regression analysis of the 5 lncRNAs and clinicopathologic parameters in the entire set. (D) The multivariate Cox regression analysis of the 5 lncRNAs and clinicopathologic parameters in the train set. (E) The multivariate Cox regression analysis of the 5 lncRNAs and clinicopathologic parameters in the test set. (F) The multivariate Cox regression analysis of the 5 lncRNAs and clinicopathologic parameters in the entire set. (G) The ROC analysis of the autophagy-related prognostic signature and clinicopathologic features in the train set. (H) The ROC analysis of the autophagy-related prognostic signature and clinicopathologic features in the test set. (I) The ROC analysis of the autophagy-related prognostic signature and clinicopathologic features in the entire set.
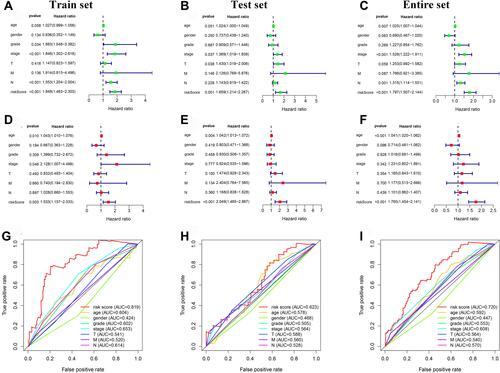
Figure 6 The relationship between the risk score from the autophagy-related lncRNA prognostic signature and clinicopathological features.
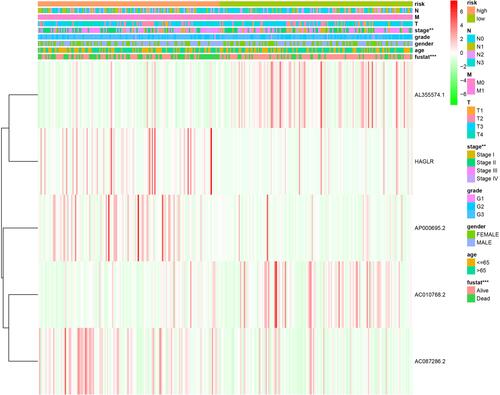
Figure 7 The survival differences between high- and low-risk GC patients stratified by clinicopathological characteristics. (A–N) The difference in overall survival stratified by age (< 65 and ≥ 65), gender (female and male), grade (low grade and high grade), tumor stage (stage I+II and stage III+IV), T stage (T1+2 and T3+4), N stage (N0+1 and N2+3), M stage (M0, M1) between two groups.
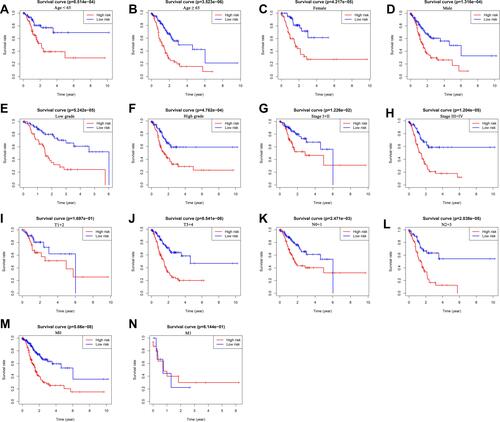
Figure 8 Tumor mutational burden analysis. (A and B) The top 30 mutational genes in the high-risk and low-risk groups.
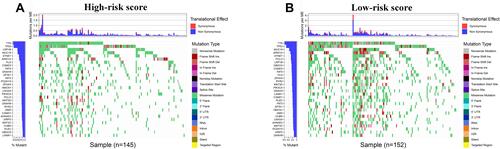
Figure 9 The association between the risk score and infiltrating immune cells. (A) The ratio differentiation of infiltrating immune cells between the high-risk and low-risk groups. (B–D) 3 kinds of infiltrating immune cells associated with the risk score.
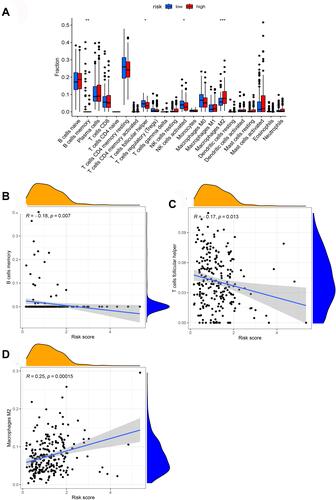
Figure 10 The correlation between the risk score and the characterization of tumor immune microenvironment. (A) The value of 25 immune-related signatures between the high-risk and low-risk groups. (B) The heatmap of 25 immune-related signatures. *P < 0.05, **P < 0.01, ***P < 0.001.
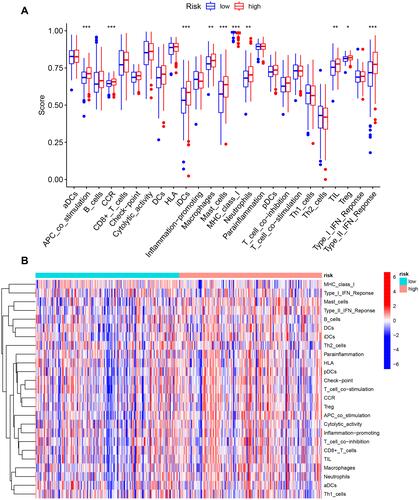
Figure 11 LncRNA-mRNA co-expression network and functional enrichment analysis. (A) Construction of the lncRNA-mRNA co-expression network based on 5 autophagy-related lncRNAs. (B) A Sankey diagram showed the correlation of lncRNAs, mRNAs, and risk type. (C) GO analysis of the mRNAs co-expressed with 5 autophagy-related lncRNAs. (D) KEGG analysis of the mRNAs co-expressed with 5 autophagy-related lncRNAs.
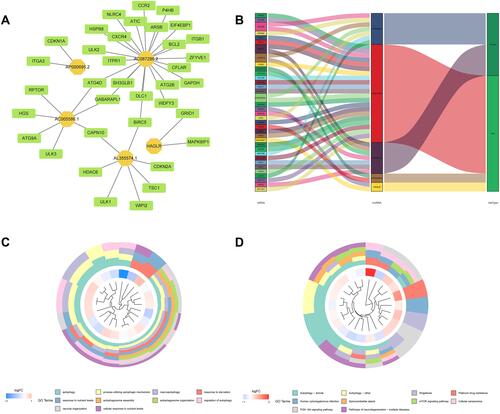
Figure 12 The differences and similarities among grouped samples. (A) PCA of the whole-genome expression profiles. (B) PCA of autophagy-related lncRNA set. (C) PCA of the 5 autophagy-related lncRNA prognostic signature.
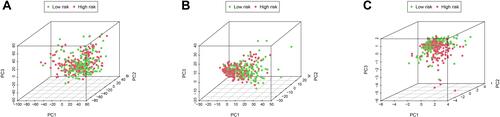
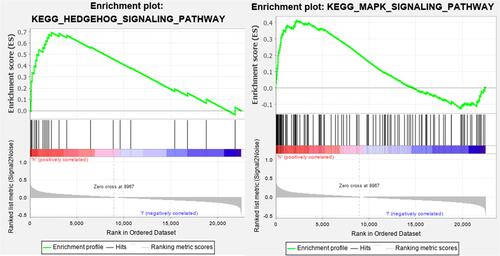
Figure 13 GSEA of GC patients based on the autophagy-related lncRNA prognostic signature.