Figures & data
Table 1 Clinical Information of the Study Population
Figure 1 Data analysis workflow.
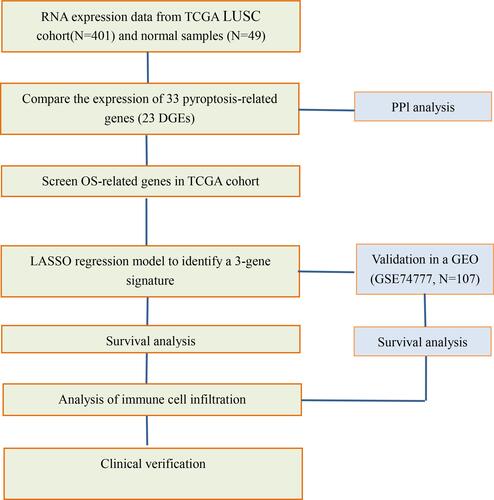
Figure 2 Expression and interaction of 23 pyroptosis-related genes. (A) Heat map showing the expression of pyroptosis-related genes between normal (N, blue) and tumor tissues (T, red) (green: low expression levels; red: high expression levels); (B) protein-protein interaction (PPI) network showing interactions for pyroptosis-related genes (interaction confidence 0.9); (C) network correlations for pyroptosis-related genes (red: positive correlation; blue: negative correlation; color depth reflects the intensity of the correlation).
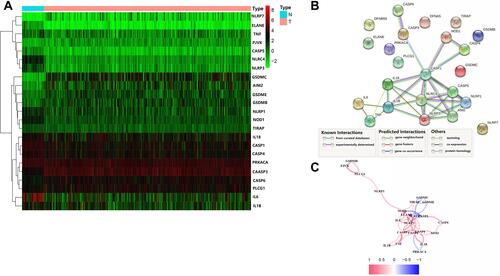
Figure 3 Univariate Cox regression analysis of overall survival (OS) for each pyroptosis-related gene, and six genes with P < 0.2.
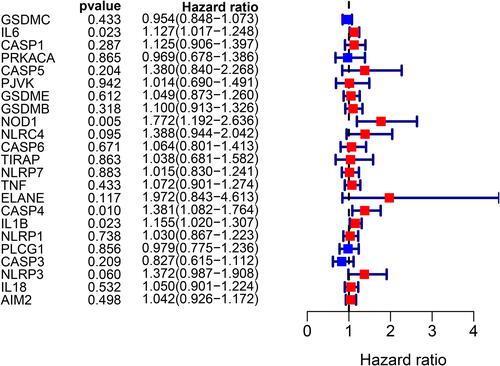
Figure 4 Random survival forest screening of the genes. (A) Estimate of random forest out-of-bag (OOB) prediction error rate based on tree number. (B) Genes with variable importance (VIMP) > 0.01.
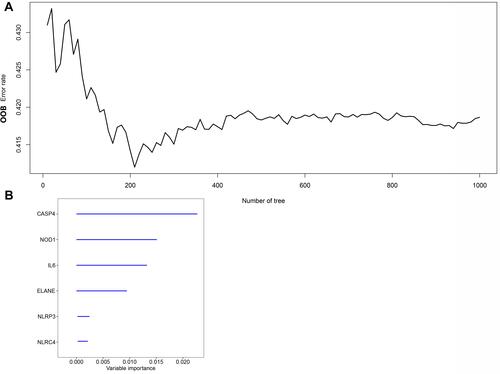
Figure 5 Construction of a risk signature using The Cancer Genome Atlas (TCGA) cohort. (A) The least absolute shrinkage and selection operator (LASSO) regression of three OS-related genes. (B) Cross-verification for tuning the parameter selection in the LASSO regression.
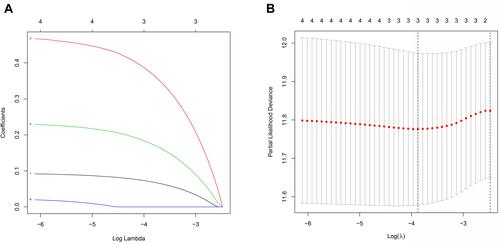
Figure 6 Comparison of high- and low-risk groups in the TCGA dataset. (A) Patient distribution based on the risk score. (B) Principal component analysis (PCA) plot for OCs based on the risk score. (C) t-SNE plot for OCs based on the risk score. (D) Survival status of each patient (low-risk group: on the left side of the dotted line; high-risk group: on the right side of the dotted line). (E) Kaplan–Meier curves for the OS of patients in the high- and low-risk groups. (F) Receiver operating characteristic (ROC) curves demonstrated the predictive efficiency of the risk score.
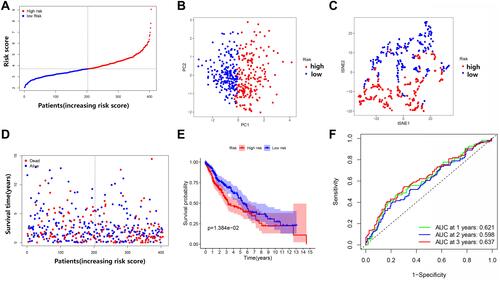
Figure 7 Comparison of high- and low-risk groups in the Gene Expression Omnibus (GEO) dataset. (A) The distribution of patients based on the risk score. (B) PCA plot for OCs based on the risk score. (C) t-SNE plot for OCs based on the risk score. (D) The survival status of each patient (low-risk group: on the left side of the dotted line; high-risk group: on the right side of the dotted line). (E) Kaplan–Meier curves for the OS of patients in the high- and low-risk groups. (F) ROC curves demonstrating the predictive efficiency of risk score.
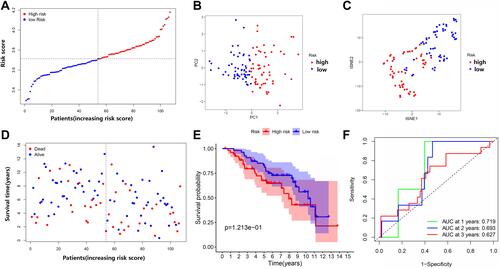
Figure 8 Univariate and multivariate Cox regression analyses for risk factors. (A) Univariate analysis of the LUSC-TCGA cohort. (B) Multivariate analysis in the LUSC-TCGA cohort. (C) Heatmap (green: low expression; red: high expression) for the connections between clinicopathologic features and risk groups.
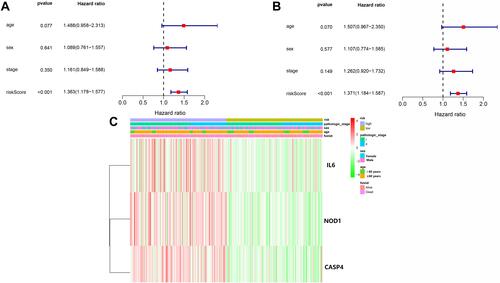
Figure 9 Functional analysis of differentially expressed genes (DEGs) in the two subgroups of the TCGA cohort. (A) Bar chart for GeneOntology (GO) enrichment (the longer the bar, the richer the gene enrichment, and the darker the red the greater the difference). (B) Bar chart for Kyoto Encyclopedia of Genes and Genomes (KEGG) pathways (the longer the bar means the more genes enriched, and darker the red the greater the difference).
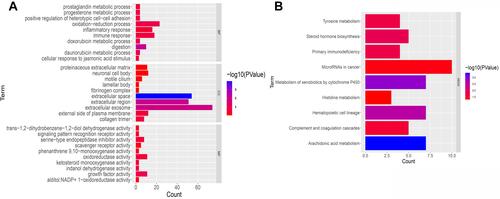
Figure 10 Comparison of the single-sample gene set enrichment (ssGSEA) scores for immune cell types and immunological pathways. (A and B) Comparison of enrichment scores for 16 types of immune cells and 13 immune-related pathways between the low-risk group (blue box) and the high-risk group (red box) in the TCGA cohort. (C and D) Comparison of enrichment scores for 16 types of immune cells and 13 immune-related pathways between the low-risk group (blue box) and the high-risk group (red box) in the GEO cohort. P values were: NS: not significant; ***P < 0.001; **P < 0.01; *P < 0.05.
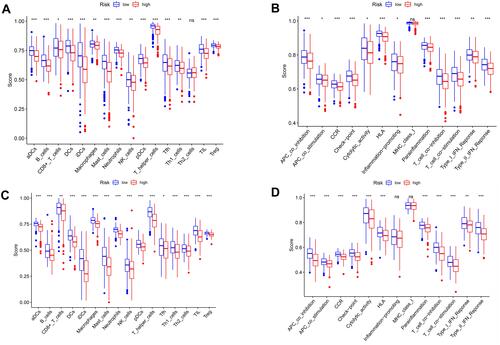
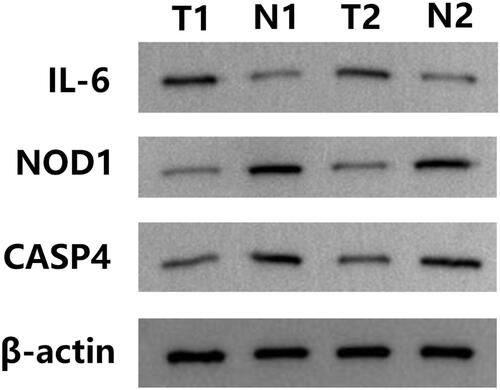
Figure 11 Relative mRNA expression of three pyroptosis-related genes in clinician-collected tissue samples. IL-6 (A) was highly expressed; NOD1 (B) and CASP4 (C) were expressed at significantly lower levels, *P < 0.05.
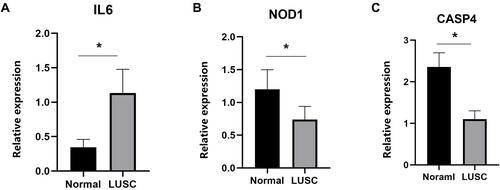
Figure 12 Relative protein expression of three pyroptosis-related genes in clinician-collected tissue. N1 and N2 represent non-tumor tissues, and T1 and T2 represent tumor tissues.