Figures & data
Table 1 Summary of Detailed Information for 33 Tumor Types in TCGA Database
Figure 1 Expression level of SELENOP in different tumors. (A) SELENOP expression in 33 tumor types (based on TCGA database). (B) The corresponding normal tissues of the GTEx database were included as controls, compared with ACC, DLBC, LAML, LGG, OV, SKCM, TGCT, UCS tumor tissues in TCGA database. (C) The expression level of SeP total protein in 6 tumors (based on CPTAC dataset). *P < 0.05, **P < 0.01, ***P < 0.001.
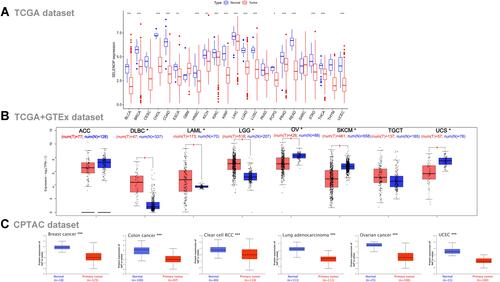
Figure 2 Association between SELENOP expression and OS, PFS and DSS. (A) Forest plot of OS associations in 33 types of tumor. (B) Forest plot of PFS associations in 33 types of tumor. (C) Forest plot of DSS associations in 33 types of tumor.
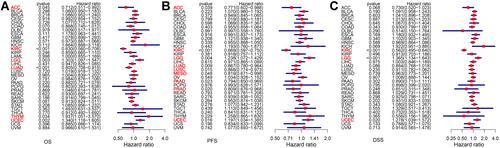
Figure 3 Kaplan–Meier analysis of the association between SELENOP expression and OS. (A) Kaplan–Meier plot of high and low SELENOP expression in KIRC patients. (B) and in LGG patients. (C) and in LUAD patients. (D) and in UCEC patients.
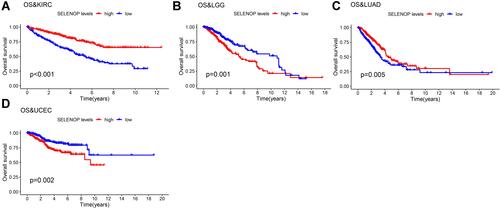
Figure 4 Mutation feature of SELENOP in different tumor types of TCGA. (A) The genetic alteration type and frequency of SELENOP in various tumors (based on the cBioPortal tool). (B) The potential correlation between mutation status and disease-specific survival of UCEC. (C) and progression-free survival of UCEC. (D) and overall survival of UCEC. (E) disease-free survival of UCEC.
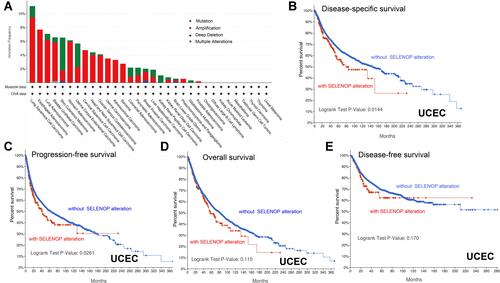
Figure 5 Associations between SELENOP expression and microsatellite instability (MSI), tumor mutational burden (TMB) and mismatch repair (MMR) in 33 tumor types. (A) Results of correlation analysis between SELENOP expression in 33 tumor types and MSI. (B) and TMB. The P-value is supplied. The correlation coefficient values of +0.4 and – 0.4 are marked. (C) and five MMR genes. The top left triangle represents the P-value, and the bottom right triangle represents the correlation coefficient. *P < 0.05, **P < 0.01 and ***P < 0.001.
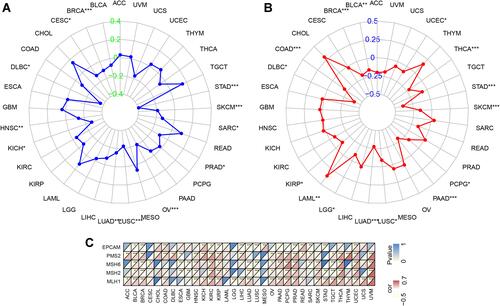
Table 2 Correlation Between SELENOP and Macrophage Gene Markers Based on GEPIA Online Tool, Including TAM and M1 and M2 Macrophages
Figure 6 Associations between SELENOP expression and tumor immune infiltration. (A) Correlation analysis between expression levels of SELENOP and immune cell infiltration in KIRC. (B) and in LGG. (C) and in LUAD. (D) and in SKCM.
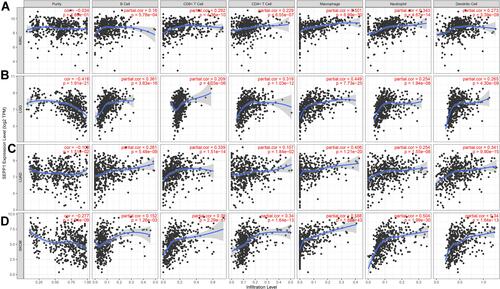
Figure 7 Six tumors with the highest correlation coefficients between SELENOP expression and the tumor microenvironment. (A) Correlation between SELENOP and stromal scores in TGCT, SKCM, SARC, PCPG, KIRP and PAAD. (B) Correlation between SELENOP and immune scores in SARC, SKCM, PAAD, GBM, PCPG and KIRP.
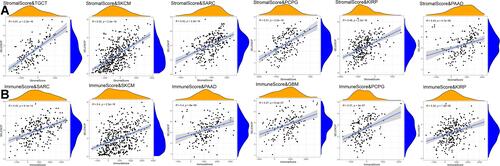
Figure 8 PPI network for SELENOP based on GeneMANIA online tool. Different colors of the network edge indicate the bioinformatics methods applied: physical interaction, co-expression, predicted, colocalization, pathway, genetic interaction, and shared protein domains.
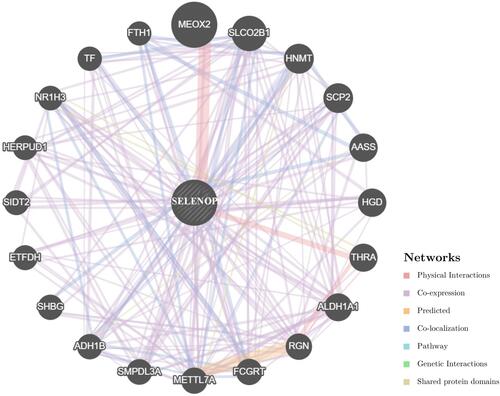
Figure 9 GO functional annotation of GSEA of SELENOP in various tumor types. (A) A common feature in LGG and UCEC was that SELENOP negatively regulated vascular endothelial cell proliferation. (B) SELENOP expression was negatively correlated with epidermal cell differentiation, keratinization and epidermis development in KIRC, LUAD and STAD. (C) In COAD, PCPG and SKCM, the process of upregulation was related to immune function, including T cell activation, B cell mediated immunity, adaptive immune response and immune response regulation cell surface receptor signaling pathways.
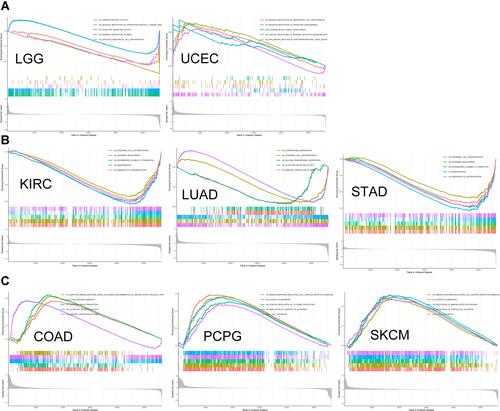
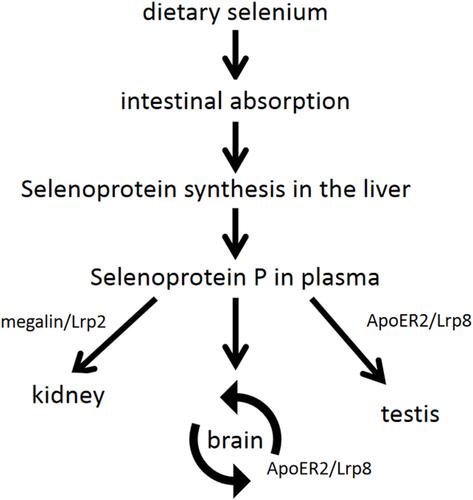
Figure 10 Summary of the transport function of SeP. Dietary Se is absorbed through the small intestine, and various Se compounds synthesize selenoprotein in the liver via circulation of portal vein, including SeP. Plasma SeP preferentially transports Se to various target tissues, such as the brain, kidney and testis. SeP transport in the brain is complicated because Se passes through multiple cell membranes before eventually reaching neurons. The neuronal SeP synthesis and ApoER2/Lrp8-mediated SeP reuptake in the brain are called the SeP cycle. Testicular function is also dependent on ApoER2/Lrp8-mediated SeP uptake. Megalin/Lrp2 is expressed in renal tubular epithelium and is involved in the reabsorption of SeP from glomerular filtrate.