Figures & data
Table 1 Clinicopathologic Characteristics According to Expression Level of LIPH in TCGA Databases
Table 2 Clinicopathologic Characteristics According to Expression Level of LIPH in METABRIC Databases
Figure 1 LIPH expression pattern in breast cancer in TCGA database (A–H). (*P < 0.05, **P < 0.01, ***P < 0.001, ****P < 0.0001).
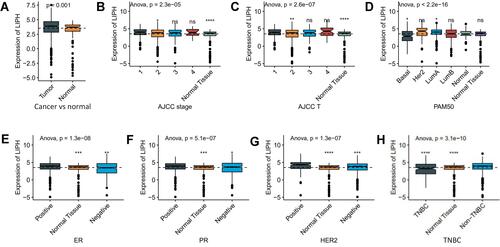
Figure 2 Survival curves according to the expression level of LIPH using TCGA (A, C–H) and METABRIC (B) databases. PAM50: A 50-gene signature that classifies breast cancer into five molecular intrinsic subtypes: Luminal A, Luminal B, HER2-enriched, Basal-like, and Normal-like. Luminal A subtype (ER or PR positive, or both, HER2 negative); luminal B subtype (ER or PR positive, or both, HER2 negative); HER2 subtype (HER2 positive, ER or PR negative or positive); Basal subtype (HER2 negative and ER and PR negative).
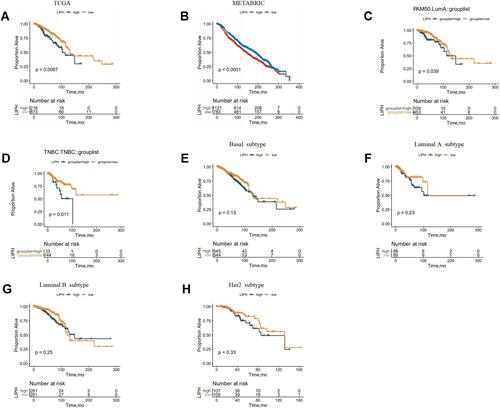
Figure 3 Survival curves according to the expression level of LIPH in each subtype of breast cancer using METABRIC database (A–F).
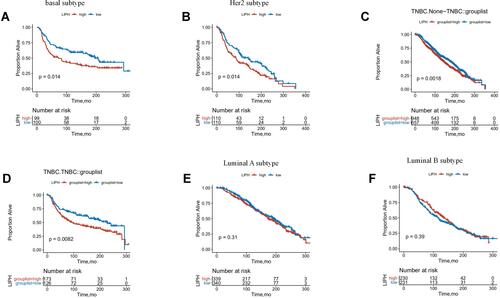
Table 3 Univariable Analyses Regarding Proportion Alive Using TCGA Databases
Table 4 Univariable Analyses Regarding Proportion Alive Using METABRIC Databases
Figure 4 Immunohistochemistry staining of LIPH in the normal breast tissue (A) and breast cancer (B).
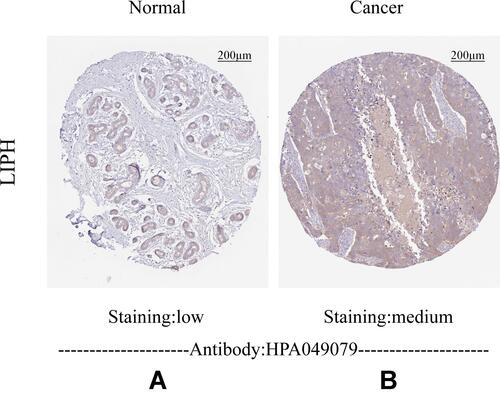
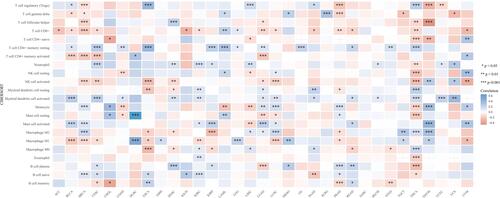
Figure 5 Correlation landscape of LIPH expression and immune cell infiltration in pan-cancer.