Figures & data
Table 1 Distribution of Demographic and Biochemical Data of Patients According to Sex
Table 2 Distribution of BA, BMC and BMD Data in Different Sites for Patient and Control Groups
Table 3 Correlation Between Serum P, Ca and ALP Levels and BMD at Different Anatomical Sites
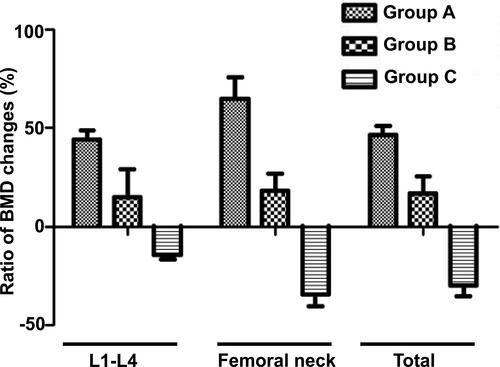
Figure 1 Observed BMD changes of HO patients after different treatments. BMD of L1–L4, the femoral neck and the total hip significantly increased (P < 0.01) after continuous treatment with a neutral phosphate solution (group A). There was no significant improvement in the BMD after intermittent treatment with a neutral phosphate solution (group B, P > 0.05). Patients not treated with a neutral phosphate solution showed decreased BMD (group C, P < 0.05).