
Figures & data
Figure 1 Different parameter settings of HM 3DE to evaluate left ventricular function. Left: ED and ES = 40 and 20, right: ED and ES = 100 and 50. Arrows: different ED and ES settings to trace the endocardium of the LV.
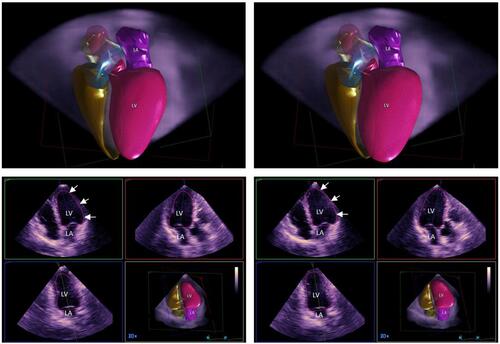
Figure 2 Conventional 3DE to evaluate left ventricular function. Left: 3D trace of the endocardium of the left ventricle, and right: 3D trace of the endocardium of the left atrium.
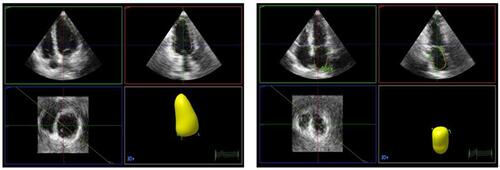
Table 1 Baseline Demographic Characteristics
Table 2 Comparison of HM Different Border Settings and 3D of Left Ventricular Systolic Function
Figure 3 Correlation analysis of different HM border settings and the conventional 3DE assessment of the left ventricular ejection fraction.
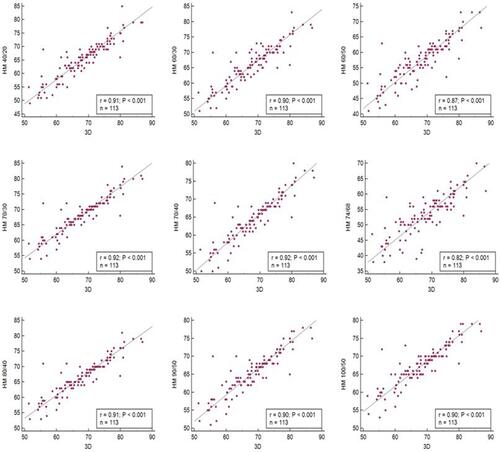
Figure 4 Up: Different parameter settings of HM to evaluate LVEF compared with conventional 3DE. Down: Different parameter settings of HM to evaluate EDV (mean) compared with conventional 3DE.
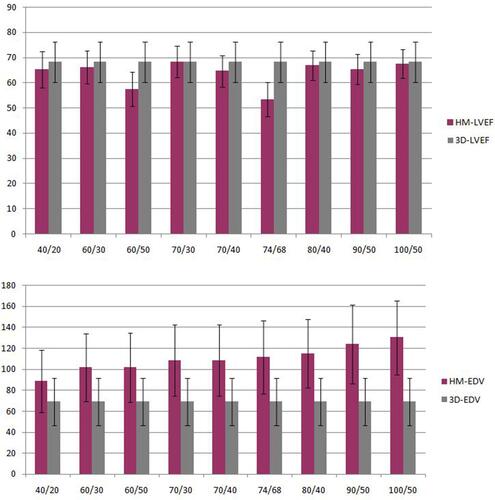
Figure 5 Left: Comparison of the agreement of LVEF between different HM border settings and conventional 3DE. ED and ES = 70 and 30 was much better than ED and ES = 74 and 68. Right: Comparison of the agreement of EDV between different HM border settings and conventional 3DE. ED and ES = 40 and 20 was much better than ED and ES = 100 and 50.
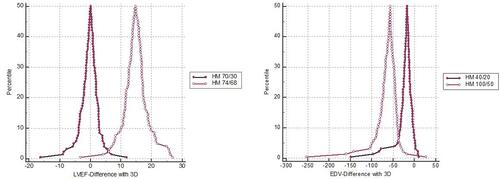
Figure 6 Agreement analysis of different HM border settings and conventional 3DE assessment of left ventricular ejection fraction.
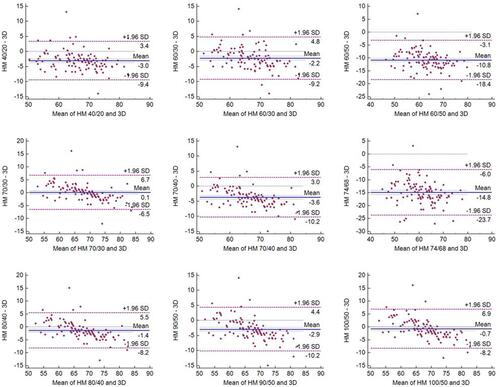
Table 3 Comparison of HM and 3D of LAVmax
Table 4 Reproducibility (Intraclass Correlation Coefficient, ICC)
Table 5 Comparison of HM and 3D Assessment of Time