Figures & data
Figure 1 Study flowchart.
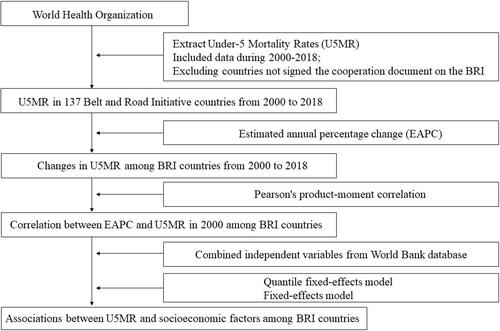
Figure 2 The burden of U5MR in 137 BRI countries. (A) U5MR in 2018; (B) The relative change in U5MR between 2000 and 2018; (C) The estimated annual percentage change of U5MR from 2000 to 2018.
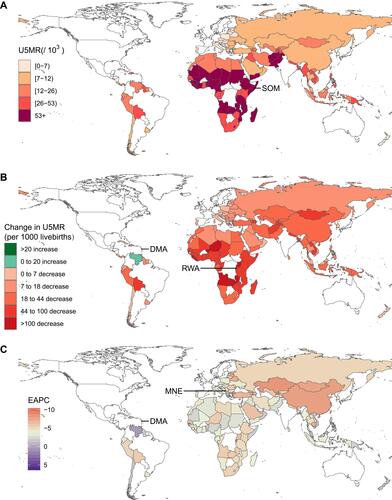
Figure 3 The correlation between EAPC and U5MR in 2000 in 137 BRI countries. The size of circle is increased with the cases of number of under-five deaths. The ρ indices and p were derived from Pearson’s product-moment correlation analysis.
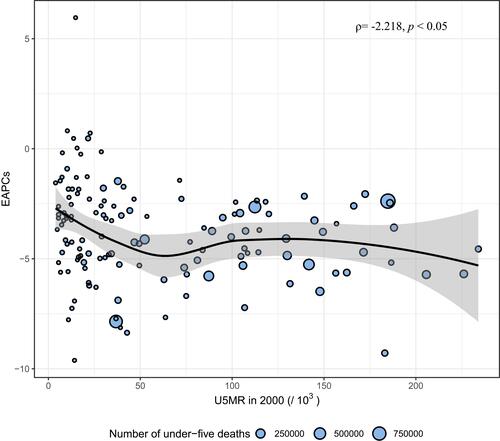
Table 1 Association Between U5MR and Socioeconomic Factors in BRI Countries
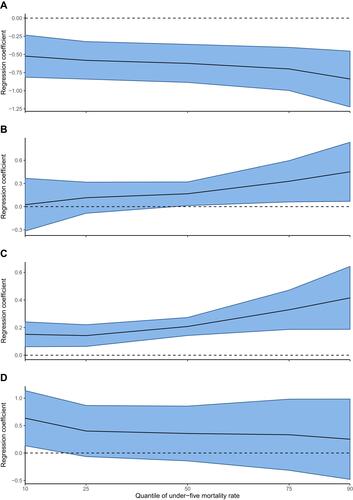
Figure 4 Quantile regression coefficients for U5MR and socioeconomic factors on percentiles of total U5MR in BRI countries. This picture shows the quantile regression coefficients (dark blue line) with 95% CI for the relationship between U5MR and socioeconomic factors. (A) Quantile regression coefficients for GDP per capita and U5MR on percentiles of total U5MR; (B) Quantile regression coefficients for GDP growth rate and U5MR on percentiles of total U5MR; (C) Quantile regression coefficients for inflation and U5MR on percentiles of total U5MR; (D) Quantile regression coefficients for unemployment rate and U5MR on percentiles of total U5MR.