Figures & data
Figure 1 Prognosis-related biomarkers of secretome genes in TMB-high group across 14 cancer types. (A) Proportion of 565 secretome genes with significant association between gene levels and clinical outcomes across 14 solid tumors. (B) Percentage of 572 secretome genes in which genetic alterations were significantly associated with clinical outcomes for each clinical phenotype. Circles represent the fraction of secretome genes in which gene expression levels (A) and genetic alterations (B) were significantly related to clinical outcomes in different cancer types. (C) Venn diagram of 65 prognosis-related secretome genes showing associations between clinical outcome and expression levels and genetic alterations in TMB-high group. (D) Distribution of 65 prognosis-related secretome genes with clinical outcomes in different cancer types. Numbers in circles represent cancer types in which secretome genes were significantly associated with clinical outcomes. Rows represent genes, columns represent clinical outcomes.
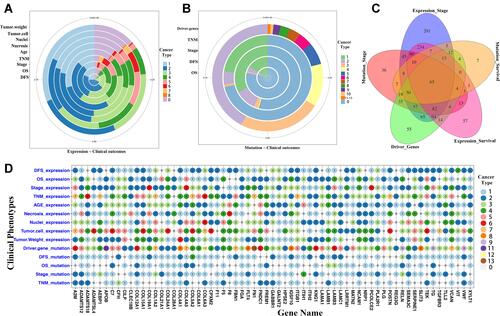
Figure 2 Identification of core genes through co-expression, mutation co-occurrence, and protein–protein interactions across 14 solid tumors in TMB-high group. (A) Gene co-expression analysis of 59 prognosis-related secretome genes among 14 solid tumors. Numbers represent cancer types with significant gene pairs. These genes were divided into three groups according to the frequency of secretome genes in significant gene pairs (red represents high group, green represents median group, and black represents low group). (B) Mutation co-occurrence analysis of 59 prognosis-related secretome genes across 14 cancer types. Genes were divided into three groups according to the frequency of secretome genes in significant gene pairs, ie, red squares indicate high group and green squares indicate median group. (C) PPI network of 52 secretome genes constructed via STRING and Cytoscape. (D) Venn diagram of 21 core secretome genes from key genes based on co-expression modules, co-occurrence of mutation, and PPI analysis.
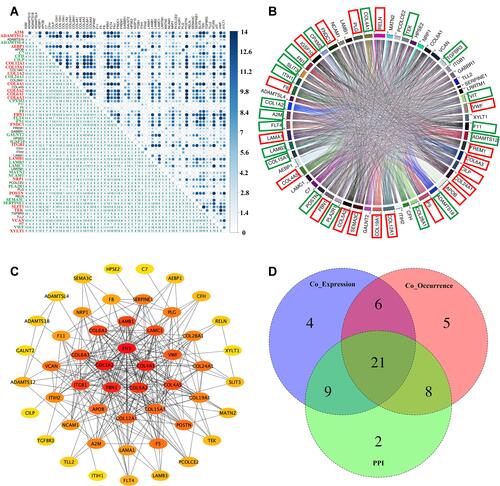
Figure 3 Correlations of 21 core secretome genes with immunomodulator genes in TMB-high group across 14 cancer types. (A) Heatmap showing correlations among 21 core secretome genes (bottom) and 24 immune-inhibitor genes (right). (B) Heatmap showing correlations among 21 core genes (bottom) and 46 immune-stimulator genes (right). Numbers in (A and B) show cancer types with significant gene pairs.
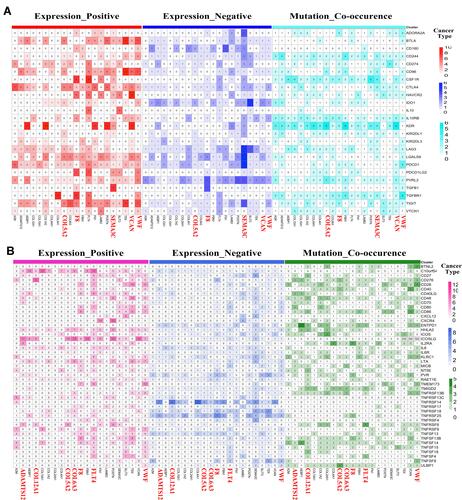
Figure 4 Correlations of 21 core secretome genes with TIICs in TMB-high group across 14 cancer types. Relationships among 21 core secretome gene expression levels and fractions of nine immune infiltration cells. Red and blue numbers indicate positive and negative correlations, respectively. Numbers show cancer types with significant gene pairs.
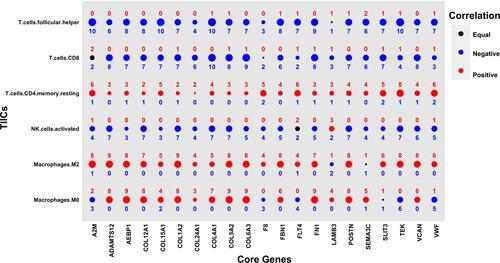
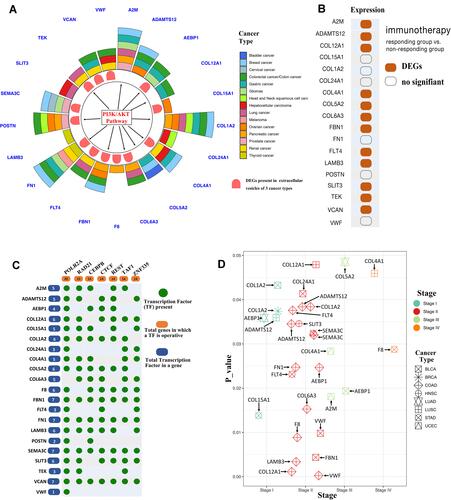
Figure 5 Functional analysis of 21 core genes. (A) Circos plot of 21 core genes based on function and differential expression in extracellular vesicles of three cancer types. Outer circle represents 21 core genes identified as potential biomarkers of different cancer types in previous studies. Middle circle represents 21 secretome genes showing differential expression in extracellular vesicles of three cancer types from the BBCancer database (http://bbcancer.renlab.org/). Inner circle represents 11 core secretome genes that may function in tumorigenesis through the PI3K/AKT signaling pathway. (B) Twelve core secretome genes sensitive to immunotherapy. (C) Predicted transcription factors of 21 core secretome genes from the GeneCards database. (D) Fifteen core secretome gene mutations were significantly enriched in stage II.