
Figures & data
Table 1 Baseline Characteristics of the Study Population
Table 2 Electrocardiogram and Coronary Features of the Study Population
Table 3 Laboratory Findings of the Study Population
Table 4 Medications During Hospitalization and After Discharge of All Groups
Figure 1 The major adverse events during hospitalization and long-term all-cause mortality of the four groups.
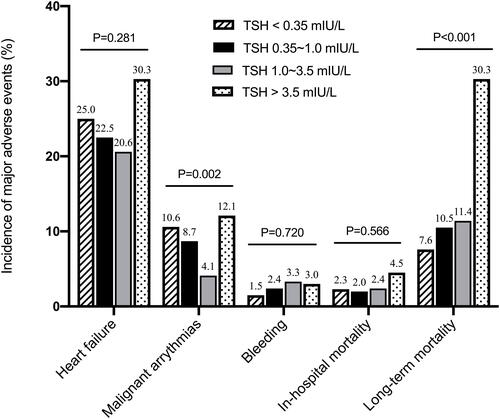
Figure 2 (A) The cumulative survival in Group 4 was remarkably lower (Log rank P < 0.001), whereas the cumulative survival was comparable in the other three groups (Log rank P = 0.365). (B) When patients were divided into two groups, the cumulative survival of patients with TSH >3.5 mIU/L was significantly lower than that of TSH ≤ 3.5 mIU/L (Log rank P < 0.001).
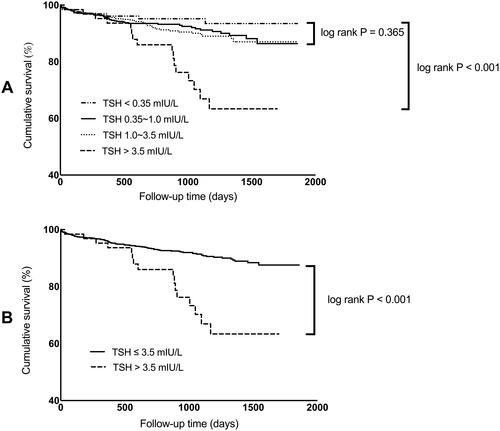
Table 5 Multivariate Cox Proportional Hazard Models of TSH in Different Levels for All-Cause Mortality in STEMI