Figures & data
Figure 1 The expression of E2F2 in HCC. (A) The expression of E2F2 between tumor and normal samples in TCGA pan-cancer. (B) The expression of E2F2 in HCC tissues and adjacent tissues. (C) The difference of E2F2 expression in normal tissues and stages 1, 2, 3, and 4 HCC patients. (D) The difference of E2F2 expression in normal tissues and grades 1, 2, 3, and 4 HCC patients. (E–H) The OS, RFS, PPS and DSS rate of HCC patients with high E2F2 expression was significantly lower than that of patients with low E2F2 expression.
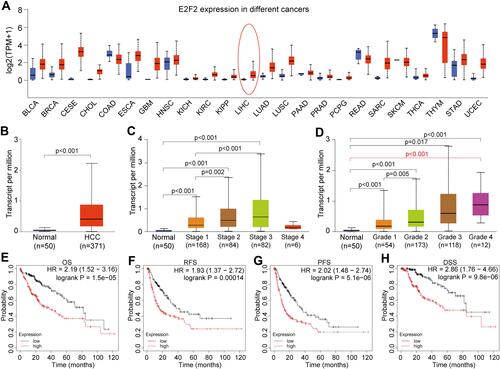
Figure 2 The gene differential expression related to E2F2. (A) The top 20 significant genes that negatively correlated with E2F2 presented in the form of heat maps. (B) The top 20 significant genes that positively correlated with E2F2. (C) GO annotation of biological process performed on E2F2-related genes by DAVID. (D) Cellular component, (E) molecular function, (F) KEGG pathway analysis.
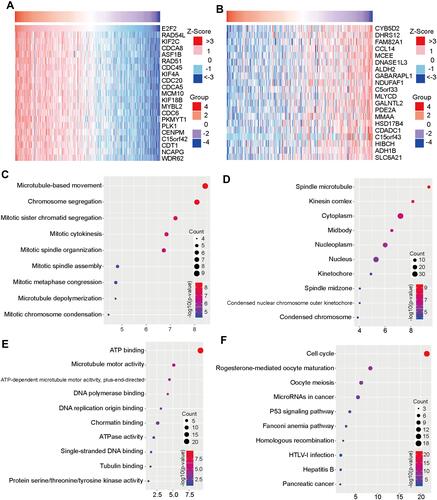
Figure 3 PPI network construction and screening of hub gene sets. (A) The protein interaction relationship was examined, and the top 100 protein interaction network was presented in the PPI network. (B) The hub gene network of E2F2 was constructed based on PPI. (C) The correlation between eight hub genes and E2F2.
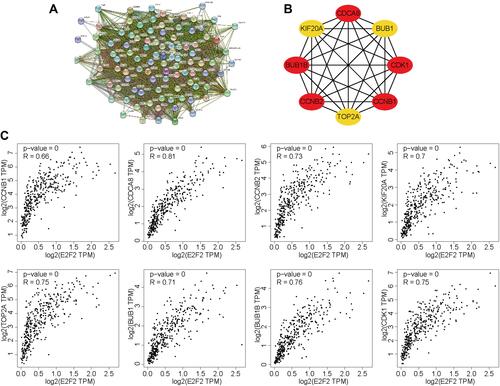
Figure 4 Co-expressed genes of E2F2. (A–I) E2F2 was co-expressed with RAD54L, KIF2C, CDCA8, CDC45, RAD51, CDC20, KIF4A, ASF1B, and PKMYT1.
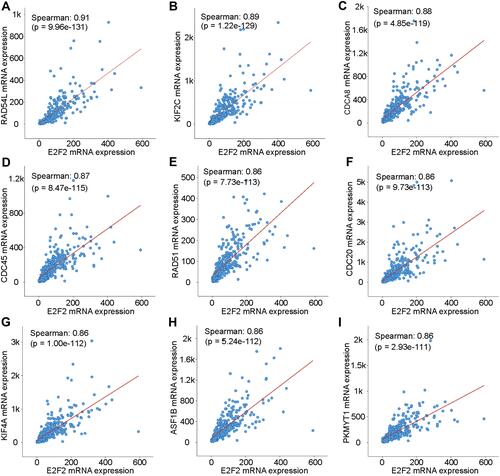
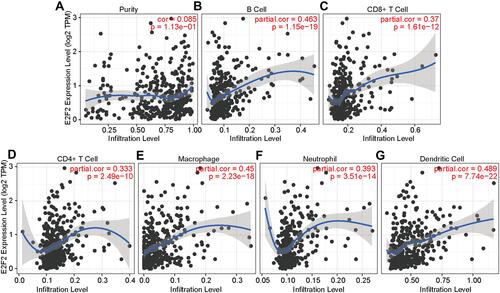
Figure 5 The relationship between E2F2 and immune infiltration. (A) E2F2 expression has no correlation with tumor purity (r = 0.085, P = 1.13E-01). (B–G) E2F2 expression was positively correlated with the six kinds of immunocytes, including B cells, CD4+ T cells, CD8+ T cells, macrophages, neutrophils, and dendritic cells. Pearson correlation was used to determine the correlation between E2F2 and immune infiltration.