Figures & data
Figure 1 Study flowchart.
Abbreviations: GO, Gene Ontology; KEGG, Kyoto Encyclopedia of Genes and Genomes.
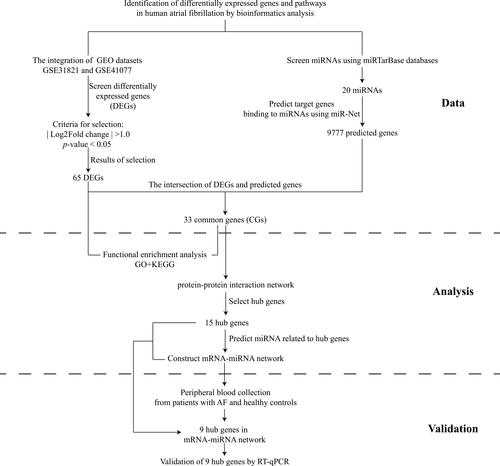
Figure 2 Volcano plots and Heatmap for the DEGs identified from the integrated dataset.
Notes: (A) Red points represent upregulated DEGs and green points denote downregulated DEGs. (B) Each row represents the DEGs and each column represents one of the samples of normal samples or AF samples. Red and blue represent upregulated and downregulated DEGs, respectively.
Abbreviations: DEG, differentially expressed gene; AF, atrial fibrillation.
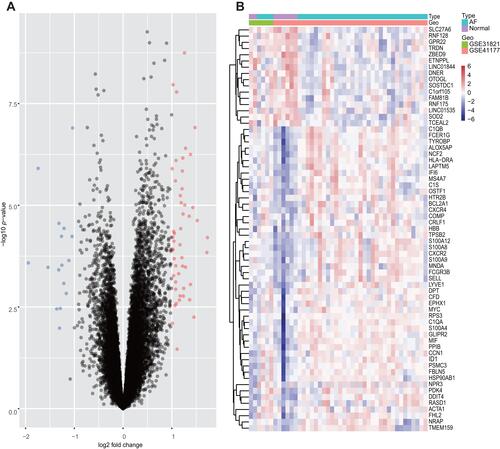
Figure 3 Terms of BP, CC and MF in pathway-enrichment analyses for DEGs using the GO database.
Notes: Red lines represent biological process. Brown lines represent cellular components. Yellow lines represent molecular function. Green lines represent the KEGG database.
Abbreviations: DEGs, differentially expressed genes; BP, biological process; CC, cellular component; MF, molecular function; GO, Gene Ontology; KEGG, Kyoto Encyclopedia of Genes and Genomes.
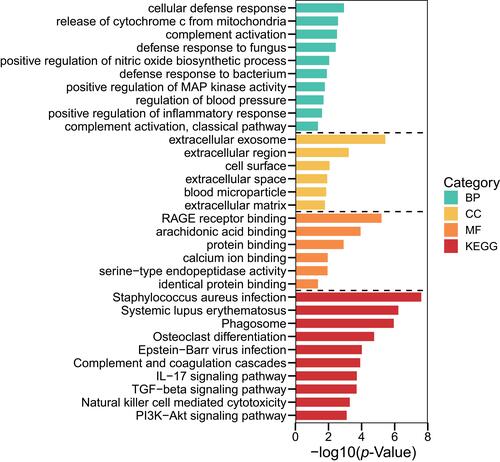
Figure 4 Venn diagram, PPI network and the functional terms and pathways enriched for common genes.
Notes: (A) Venn diagram showing common genes in the target genes of DEGs and mRNAs. (B) Red nodes represent upregulated genes, and blue nodes represent downregulated genes. (C–F) Enrichment analyses of common genes using GO and KEGG databases.
Abbreviations: PPI, Protein–protein interaction; DEGs, differentially expressed genes; mRNA, messenger RNA; GO, Gene Ontology; KEGG, Kyoto Encyclopedia of Genes and Genomes.
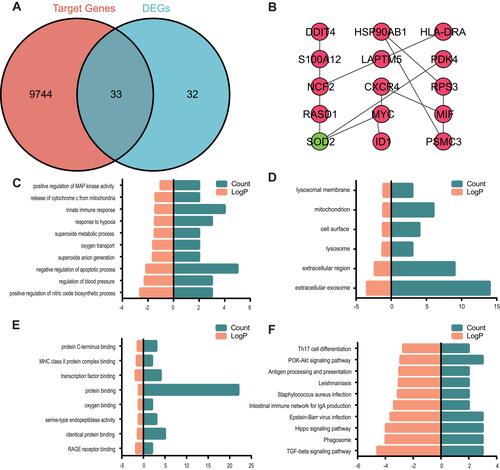
Table 1 The Nodes with Degree of ≥ 2 in the mRNA-miRNA Network
Figure 5 miRNA–mRNA integrated network.
Notes: Red balls represent upregulated mRNAs. Green balls represent downregulated mRNA. Blue triangles are predicted miRNAs.
Abbreviations: mRNA, messenger RNA; miRNA, microRNA.
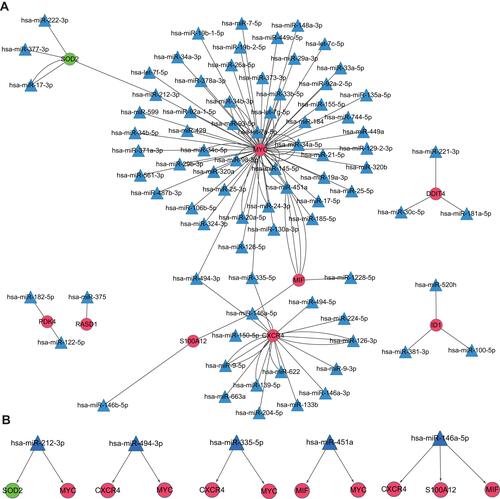
Figure 6 The drug-gene network.
Notes: Red balls, green ball, and grey squares represent upregulated mRNAs, downregulated gene, and drugs, respectively.
Abbreviation: mRNAs, messenger RNA.
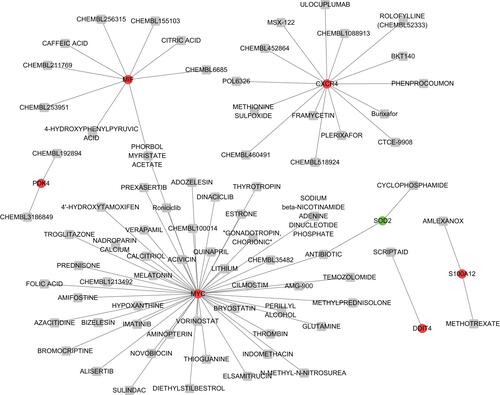
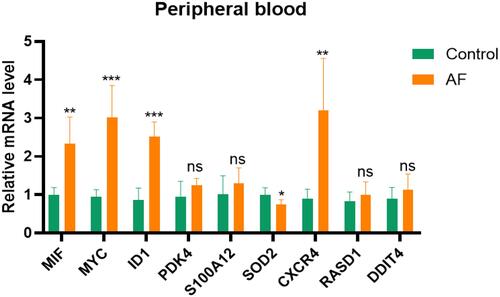
Figure 7 Validation of hub genes in AF patients.
Notes: The expression level of MIF, MYC, CXCR4, ID1, SOD2, RASD1, PDK4, DDIT4 and S100A12 determined by RT-qPCR.
Abbreviations: AF, atrial fibrillation; MYC, MYC proto-oncogene, bHLH transcription factor; CXCR4, C-X-C Motif Chemokine Receptor 4; SOD2, Superoxide Dismutase 2; MIF, Macrophage migration inhibitory factor; ID1, inhibitor of differentiation 1; DDIT4, DNA Damage Inducible Transcript 4; S100A12, S100 Calcium Binding Protein A12; RASD1, Ras Related Dexamethasone Induced 1; PDK4, Pyruvate Dehydrogenase Kinase 4.