Figures & data
Table 1 Demographic and Clinical Characteristics of the Study Population Overall and Stratified by Systolic Blood Pressure Systolic Blood Pressure
Figure 1 Clinical outcomes according to the use of glucocorticoids over 28 days among HF-LBP patients. (A) Change in dose of metoprolol; (B) change in dose of captopril; (C) change in SBP; (D) change in DBP; (E) change in heart rate; (F) change in EF; (G) change from baseline to the 7th day in urine volume; (H) change in SCr; (I) change in diuretic response. #Compared with baseline, P < 0.05; $Compared with the 7th day, P < 0.05; &Compared with the 14th day, P < 0.05; #Compared with the baseline, P < 0.05; $Compared with the 2nd day, P < 0.05; &Compared with the 3rd day, P < 0.05; *Compared with the 4th day, P < 0.05; ΔCompared with the 5th day, P < 0.05.
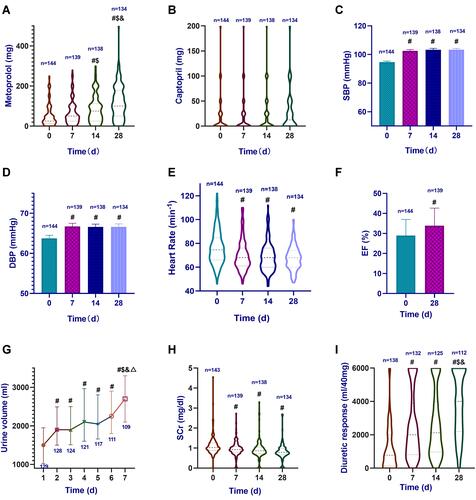
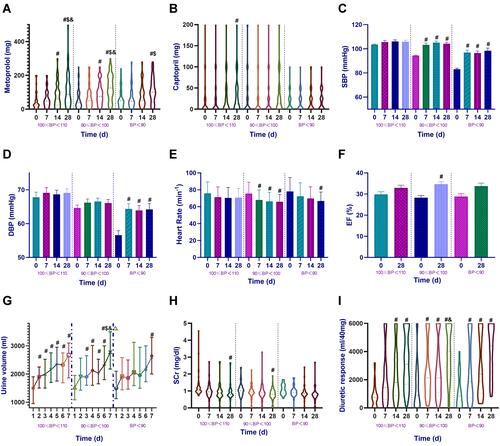
Figure 2 Subgroup analysis of clinical outcomes according to the use of glucocorticoids over 28 days among HF-LBP patients. (A) Change in dose of metoprolol; (B) change in dose of captopril; (C) change in SBP; (D) change in DBP; (E) change in heart rate; (F) change in EF; (G) change from baseline to the 7th day in urine volume; (H) change in SCr; (I) change in diuretic response. 100 ≤ BP < 110: upper tertile BP group; 90 ≤ BP < 100: medium tertile BP group; BP < 90: lower tertile BP group. #Compared with baseline, P < 0.05; $Compared with the 7th day, P < 0.05; &Compared with the 14th day, P < 0.05; #Compared with the baseline, P < 0.05; $Compared with the 2nd day, P < 0.05; &Compared with the 3rd day, P < 0.05; *Compared with the 4th day, P < 0.05; ΔCompared with the 5th day, P < 0.05.