Figures & data
Table 1 Activated Pathways in Patients That Died from Gastric Cancer
Figure 1 Identify the most functional signalling pathways in GC. (A) The different activated pathways of dead and living GC patients in the GSE62254 cohort. (B) The different activated pathways of dead and living GC patients in TCGA-STAD cohort. (C) The distribution of pathways activated in both cohorts in four quadrants. (D) The GSEA plot of three selected pathways in the GSE62254 cohort. (E) The GSEA plot of three selected pathways in the TCGA-STAD cohort.
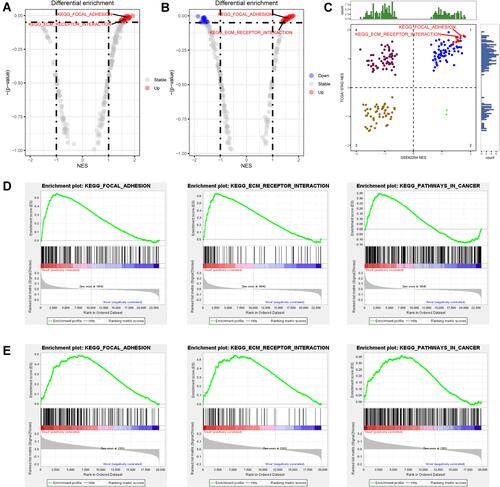
Table 2 Summary of the Clinical Features in Low-Risk and High-Risk Groups
Figure 2 Constructing the prognostic index for GC patients. (A) PCA plot showing the batch effect between TCGA-STAD and GSE62254 cohorts. (B) PCA plot showing the distribution of two cohorts after removing the batch effect. (C) The optimal tuning parameter (Lambda) in the LASSO analysis selected with the 5-fold cross-validation and one standard error rule. (D) LASSO coefficient profiles of the 211 genes. (E) Heatmap showing the expression distribution of LASSO analysis selected genes and corresponding clinical features among two cohorts.
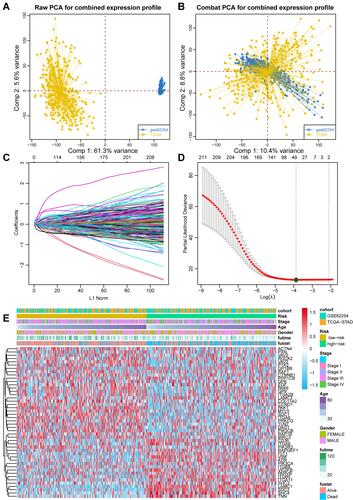
Figure 3 Prognostic value of the GCPI in combined and separated GC cohorts. (A) K-M plot showing the divergent overall survival in the dichotomized risk groups in the combined cohort. (B) ROC curve showing the prognostic value of GCPI in the combined cohort. (C) K-M plot showing the divergent overall survival in the dichotomized risk groups in the TCGA-STAD cohort. (D) ROC curve showing the prognostic value of GCPI in the TCGA-STAD cohort. (E) K-M plot showing the divergent overall survival in the dichotomized risk groups in the GSE62254 cohort. (F) ROC curve showing the prognostic value of GCPI in the GSE62254 cohort.
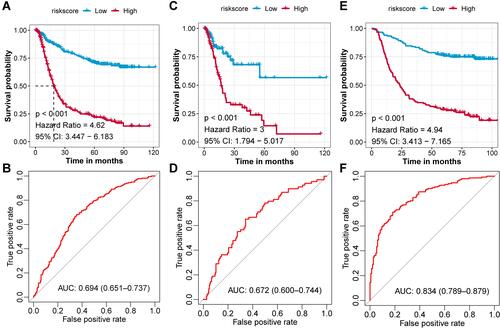
Figure 4 Independent prognostic value of GCPI to patients. (A) Forest plot showing the independent prognostic value of GCPI after adjusting for clinicopathological factors in the TCGA-STAD cohort. (B) ROC curve showing the single and integrative prognostic value of features in the TCGA-STAD cohort. (C) Forest plot showing the independent prognostic value of GCPI after adjusting for clinicopathological factors in the GSE62254 cohort. (D) ROC curve showing the single and integrative prognostic value of features in the GSE62254 cohort. *P < 0.05; **P < 0.01; ***P < 0.001; ****P < 0.0001.
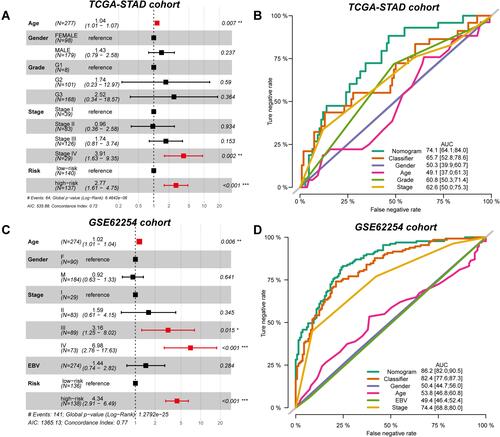
Figure 5 Dendritic cells promote the progression of GC patients. (A) The correlations between immunocytes and GCPI in the TCGA-STAD cohort. (B) The correlations between immunocytes and GCPI in the GSE62254 cohort. (C) The infiltration of plasmacytoid dendritic cells positively associated with GCPI in the TCGA-STAD cohort. (D) The infiltration of plasmacytoid dendritic cells positively associated with GCPI in the GSE62254 cohort. (E) GCPI positively associated with the increased expression of IFNAR2. (F) GCPI positively associated with the increased expression of IFNAR1. (G) mRNA expression of IFNAR1 was significantly higher in tumour tissue than adjacent normal tissue. (H) Protein level of IFNAR1 was significantly higher in tumour tissue than normal tissue. (I) Patients with high expression of IFNAR1 and high infiltration of dendritic cells had the worst prognosis. *P < 0.05.
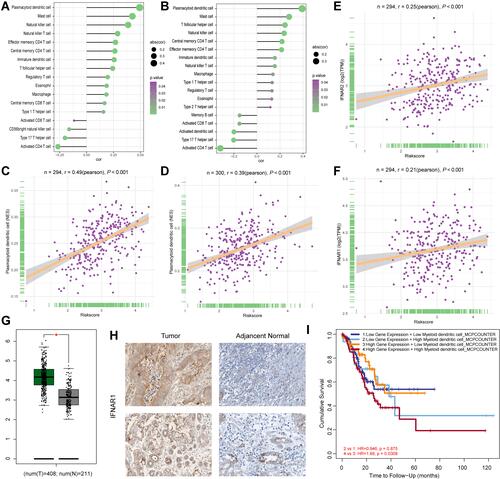
Figure 6 CTLA4 immunotherapy is a potential treatment for GC patients with high GCPI. (A) Submap results showing the potential response to CTLA4 treatment of the TCGA-STAD cohort compared with the melanoma cohort. (B) Submap results showing no response to PDL1 treatment of the TCGA-STAD cohort compared with the IMvigor210 cohort. (C) Submap results showing the potential response to CTLA4 treatment of the GSE62254 cohort compared with the melanoma cohort. (D) Submap results showing no response to PDL1 treatment of the GSE62254 cohort compared with the IMvigor210 cohort.
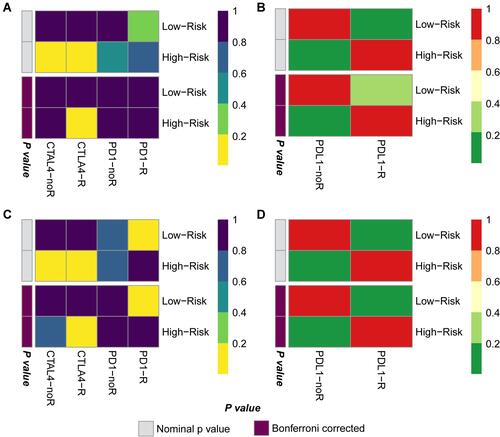
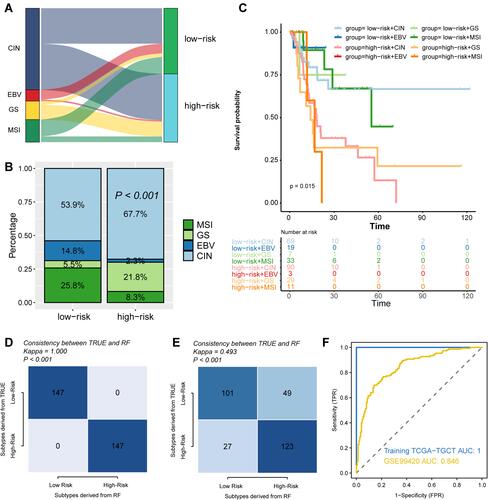
Figure 7 Compared the risk groups with proposed GC molecular subtypes and reproduced the risk groups with minimal genes. Comparing the distribution of GC patients in risk groups and proposed GC molecular subtypes by Sanky plot (A) and Stacking histogram (B). (C) K-M plot showing the diverse clinical prognosis of GC patients in eight subgroups. (D) Comparison of subtypes reproduced with 11 genes and defined by LASSO analysis in TCGA-STAD cohort. (E) Comparison of subtypes reproduced with 11 genes and defined by LASSO analysis in GSE62254 cohort. (F) ROC curve showing the accuracy of the predicting risk groups by 11 genes.