Figures & data
Table 1 Basic Characteristic
Figure 1 Timeline of symptoms onset and RT-PCR. Light green represents symptoms, yellow represents positive RT-PCR detection from respiratory samples, red represents positive RT-PCR detection from gastrointestinal samples, black represents negative RT-PCR detection.
![Figure 1 Timeline of symptoms onset and RT-PCR. Light green represents symptoms, yellow represents positive RT-PCR detection from respiratory samples, red represents positive RT-PCR detection from gastrointestinal samples, black represents negative RT-PCR detection.](/cms/asset/07a2ebd6-c32e-487b-a7f9-2902751a1218/dijg_a_12168514_f0001_c.jpg)
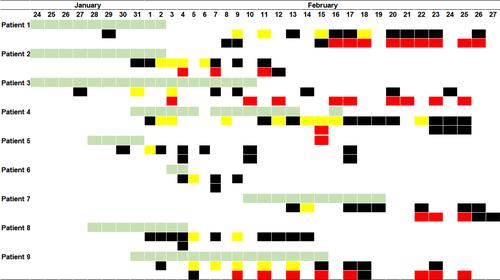
Table 2 Clinical Symptoms, Laboratory Findings and Oxygen Support
Figure 2 Timeline charts illustrate the mean laboratory parameters in various stages. On the left primary vertical axis is the quantitative variable and on the right secondary axis is the ratio. (A) Neutrophil Count, Lymphocyte Count and ratio of them among each stage. (B) ALT, AST and ratio of them among each stage. (C) Alb, Glb and ratio of them among each stage.
![Figure 2 Timeline charts illustrate the mean laboratory parameters in various stages. On the left primary vertical axis is the quantitative variable and on the right secondary axis is the ratio. (A) Neutrophil Count, Lymphocyte Count and ratio of them among each stage. (B) ALT, AST and ratio of them among each stage. (C) Alb, Glb and ratio of them among each stage.](/cms/asset/f4db1af5-52c1-49cb-841d-592349ef1f43/dijg_a_12168514_f0002_c.jpg)
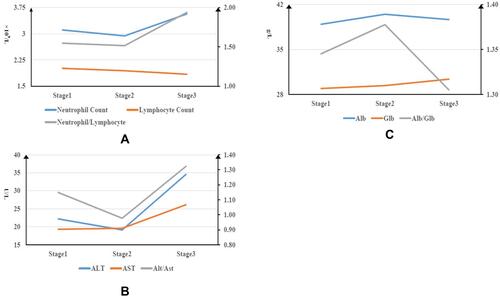
Table 3 CT Scan Features