
Figures & data
Figure 1 Expression of MPS-1 in HCC databases. (A) Analysis of HCC datasets in the Oncomine database to assess the expression of MPS-1. The data are presented with box plots. Fold change, *P value (determined by Student’s t-test). (B) Analysis of the expression of MPS-1 in TCGA, GSE76297 and GSE84598 datasets.
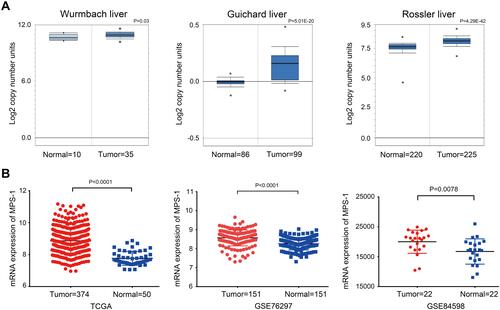
Figure 2 Expression of MPS-1 protein was examined by IHC. (A) Typical images of the expression of MPS-1 protein examined by IHC. (B) Statistical analysis of MPS-1 expression in the surrounding and HCC tissues. (P < 0.05). (C) Expression of MPS-1 in stage I to IV HCC tissues examined in the GEPIA database. (D) Expression of MPS-1 in stages I to IV in 169 HCC tissue samples.
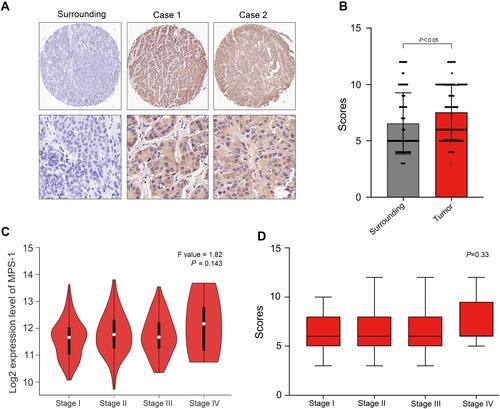
Table 1 Expression of MPS-1 in HCC and Its Correlation with Clinical Variables
Figure 3 Survival of HCC patients with MPS-1 expression. (A) Kaplan–Meier curves of OS in HCC patients with high and low MPS-1 expression (P<0.01). (B) Kaplan–Meier curves of PFS in HCC patients with high and low MPS-1 expression.
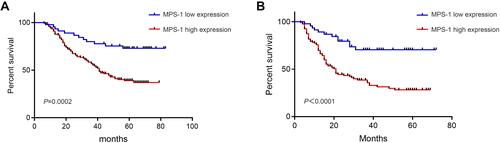
Figure 4 Overall survival of HCC patients with different clinical factors. (A) Kaplan–Meier curves of OS in HCC patients with low (< 400 μg/L) or high (≥ 400 μg/L) levels of serum AFP (P < 0.05). (B) Kaplan–Meier curves of OS in HCC patients with or without cirrhosis (P < 0.05). (C) Kaplan–Meier curves of OS in HBsAg-negative (P =0.099) or HBsAg-positive HCC patients (P < 0.05).
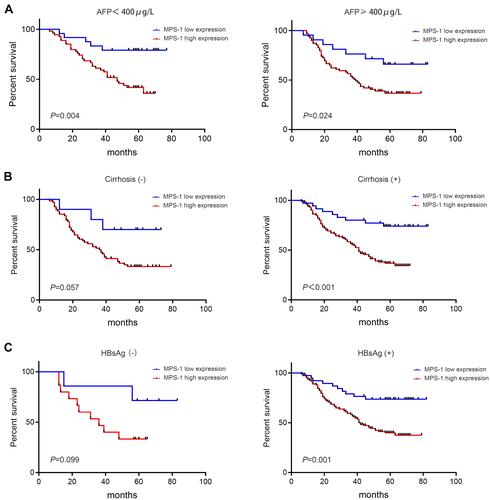
Table 2 Univariate and Multivariate Cox Regression Analysis of Different Prognosis Factors in HCC Patients