Figures & data
Figure 1 LV LS analysis at rest (A) and postexercise (B). LV LS of base, middle and apex were all increased after exercise, especially the apex.
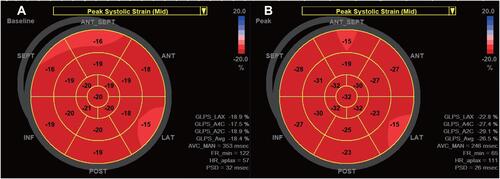
Table 1 Characteristics of the Population
Table 2 Conventional Treadmill Exercise Stress Echocardiographic Parameters of the Left Ventricle
Figure 2 LS changes during exercise at different levels of LV. The strain gradient at different levels of LV did not change either at rest or postexercise, with the highest LS at apex and the lowest LS at the base of LV. The LS of the apex increased much more than the other two levels.
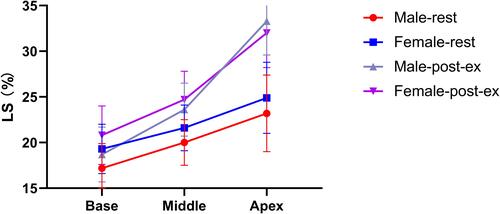
Table 3 Changes in Exercise Characteristics
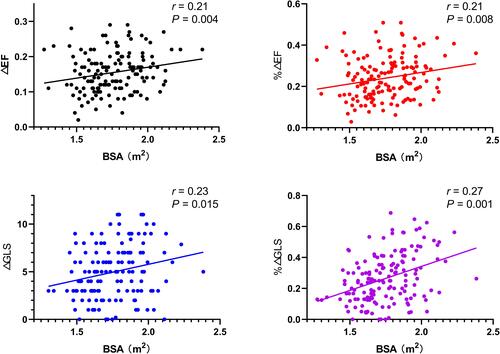
Figure 3 Correlation between parameters of LV contractile reserve and BSA. LV, left ventricle; BSA, body surface area; EF, ejection fraction; GLS, global longitudinal strain; %ΔEF, percentage of EF increase compared to rest; %ΔGLS, percentage of GLS increase compared to rest.