Figures & data
Figure 1 Flowchart diagram for bioinformatics analysis in this study.
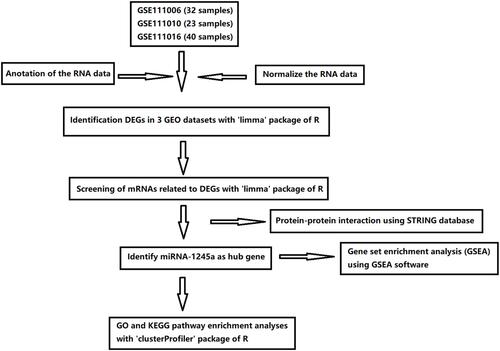
Figure 2 Analysis of differentially expressed genes (DEGs). (A) Volcano plot of the DEGs identified by integrated analysis of the GEO datasets (red dot represents upregulated gene, blue dot represents down-regulated gene). A cutoff of a 1-fold change and FDR of <0.25 were used as the threshold values to determine DEG significance. (B) The heat map shows the expression of DEGs in sarcopenia patients compared to controls (red bars represent sarcopenia population, blue bars represent healthy population). (C) Violin plot analysis was performed to compare the expression of DEGs (red represents sarcopenia population, blue represents healthy population).
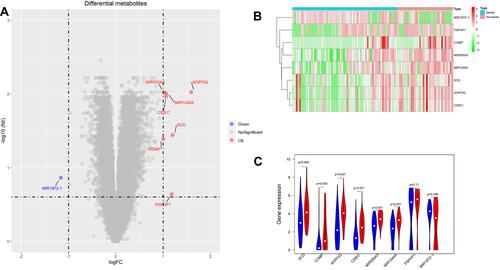
Figure 3 GSEA plots of four gene sets that were significantly differentiated between high- and low-miRNA-1245a expression groups. The median expression of miRNA-1245a was selected as the cut-off value.
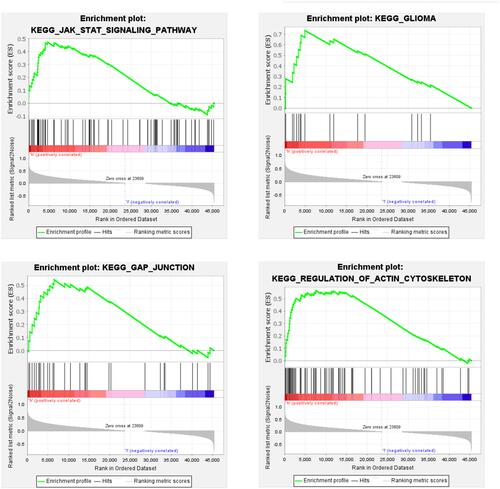
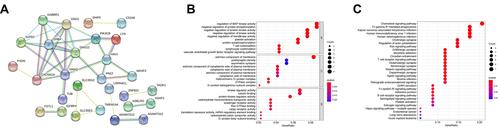
Figure 4 (A) PPI network diagram of miRNA-1245a-related genes. (B) GO analysis of miRNA-1245a-related genes. (C) KEGG analysis of miRNA-1245a-related genes.