Figures & data
Table 1 Coefficient and Survival Analysis of Included lncRNAs Based on TCGA-LUAD Data
Figure 1 Selection of lncRNA using Lasso regression. (A) Lasso coefficient of the five included lncRNAs. (B) Profiles of Lasso coefficients. (C) Univariate analysis of included lncRNAs from the samples. *P<0.05; **P<0.01, ***P<0.001.
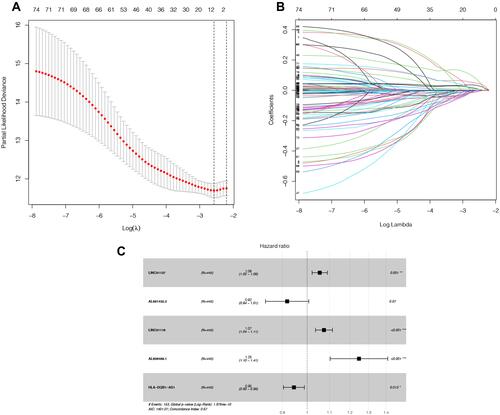
Figure 2 The Kaplan-Meier survival analysis of five included lncRNAs. LINC01137, AL606489.1, and LINC01116 were independent unfavorable factors. AL691432.2 and HLA-DQB1-AS1 were independent protective factors for lung adenocarcinoma. (A) Survival analysis of AL691432.2 in LUAD patients; (B) Survival analysis of AL606489.1 in LUAD patients; (C) Survival analysis of LINC01116 in LUAD patients; (D) Survival analysis of LINC01137 in LUAD patients; (E) Survival analysis of HLA-DQB1-AS1 in LUAD patients.
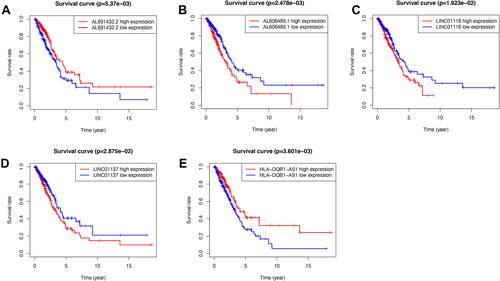
Figure 3 The co-expression network of autophagy-related lncRNA-mRNA and Sankey diagram. (A) mRNA – Autophagy-related lncRNAs – risk type relationship showed in Sankey diagram. (B) The co-expression network visualized using Cytoscape 3.7.2 software.
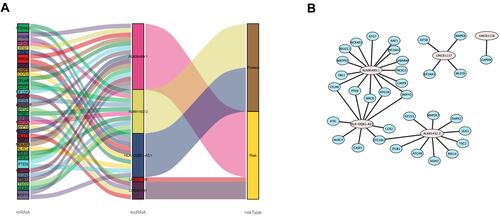
Figure 4 The prognostic indicators of the five autophagy-related lncRNAs signature. (A) 1-year survival ROC curve for LUAD patients. (B) 3-year survival ROC curve for LUAD patients. (C) 5-year survival ROC curve for LUAD patients. (D) 7-year survival ROC curve for LUAD patients. (E) Kaplan–Meier survival curve of the high-risk and low-risk groups for LUAD patients.
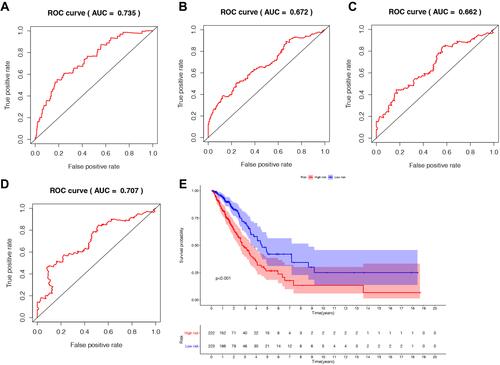
Figure 5 The analysis of the risk score from the generated risk model. (A) Expression profiles of lncRNAs in different groups; (B) the risk curve of each sample in high and low risk group; (C) the survival plot of each sample based on the risk score.
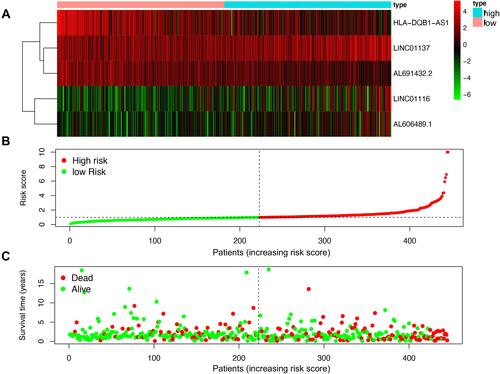
Table 2 Clinicopathological Characteristics and Risk Scores Under Univariate Cox Regression
Table 3 Clinicopathological Characteristics and Risk Scores Under Multivariate Cox Regression
Table 4 The Relationship of Clinicopathological Characteristics and Risk Score
Figure 6 The evaluation of the constructed signature’s prognostic credibility in LUAD patients. (A and B) The univariate and multivariate Cox regression analysis of risk score and clinicopathological characteristics. (D) The integrated ROC curves of risk score and clinical features; (C) The nomogram of 1-year, 3-year or 5-year survival predictability based on risk score, age, and TNM stage.
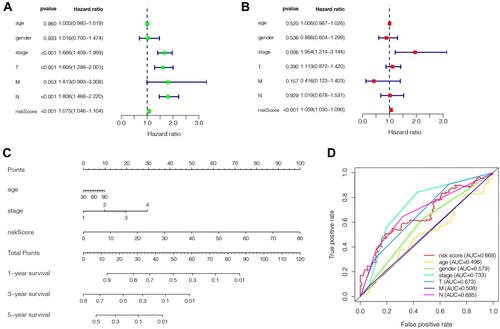
Figure 7 The functional enrichment analysis based on autophagy-related lncRNAs. (A) Upregulated gene ontology terms in high risk group; (B) Upregulated gene ontology terms in low risk group; (C) Upregulated KEGG pathways in high risk group; (D) Upregulated KEGG pathways in low risk group.
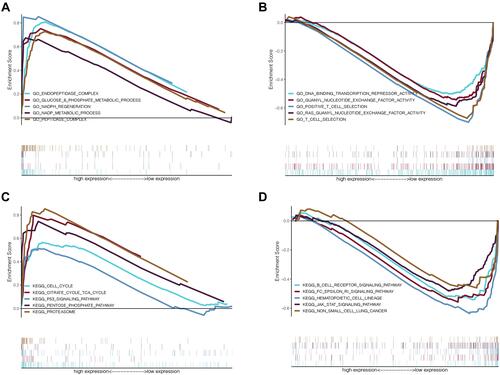
Figure 8 Validation of CFLAR-HLA-DQB1-AS1, GAPDH-LINC01116 and MLST8-LINC01137 in GEPIA database. (A) The mRNA expression levels of HLA-DQB1-AS1; (B) Kaplan–Meier survival analysis of HLA-DQB1-AS1; (C) The mRNA expression levels of CFLAR; (D) Kaplan–Meier survival analysis of CFLAR; (E) The mRNA expression levels of LINC01116; (F) Kaplan–Meier survival analysis of LINC01116; (G) The mRNA expression levels of GADPH; (H) Kaplan-Meier survival analysis of GADPH; (I) The mRNA expression levels of LINC01137; (J) Kaplan–Meier survival analysis of LINC01137; (K) The mRNA expression levels of MLST8; (L) Kaplan–Meier survival analysis of MLST8. *P<0.05.
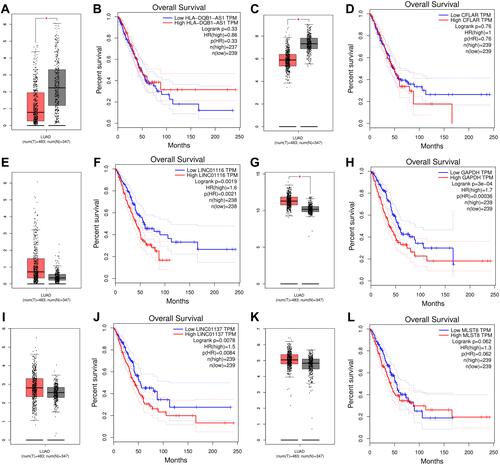
Figure 9 Correlation test in GEPIA and protein expression in HPA. (A) Spearman correlation tests for CFLAR-HLA-DQB1-AS1 in normal lung sample; (B) Spearman correlation tests for CFLAR-HLA-DQB1-AS1 in tumor sample; (C) Spearman correlation tests for GAPDH-LINC01116 in normal lung sample; (D) Spearman correlation tests for GAPDH-LINC01116 in tumor sample; (E) Spearman correlation tests for MLST8-LINC01137 in normal lung sample; (F) Spearman correlation tests for MLST8-LINC01137 in tumor sample; (G) the expression level of CFLAR in normal lung sample; (H) the expression level of CFLAR in tumor sample; (I) the expression level of GAPDH in normal lung sample; (J) the expression level of GAPDH in tumor sample; (K) the expression level of MLST8 in normal lung sample; (L) the expression level of MLST8 in tumor sample.
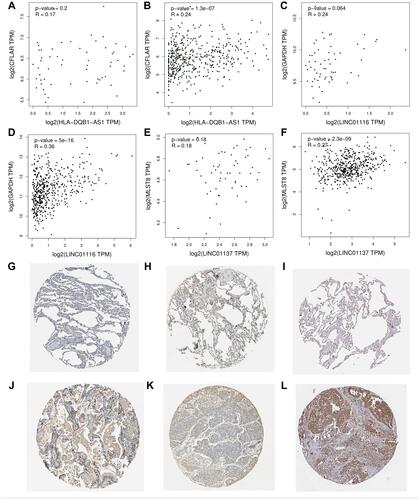
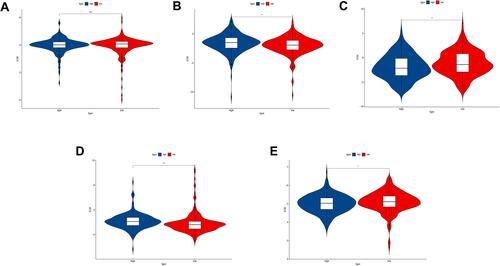
Figure 10 Drug sensitivity analysis between high-risk and low-risk group. (A) The IC50 of Cisplatin between the two groups; (B) The IC50 of Gemcitabine between the two groups; (C) The IC50 of Paclitaxel between the two groups; (D) The IC50 of Gefitinib between the two groups; (E) The IC50 of Erlotinib between the two groups. ns: no significance, *P<0.05, **P<0.01; ***P<0.001.