Figures & data
Figure 1 Workflow of the study.
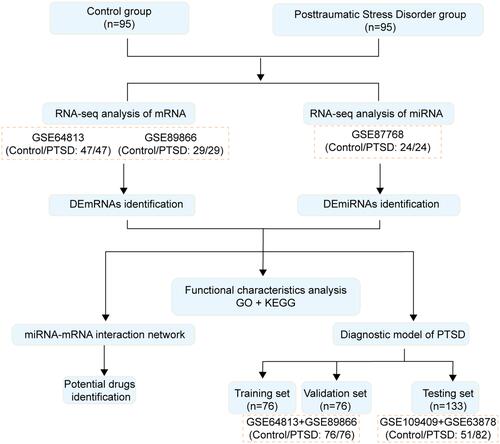
Table 1 Dataset Used in This Study
Figure 2 Expression profiles of differentially expressed genes (DEmRNAs). (A and B) Volcano map of DEmRNAs expression levels between control samples and PTSD in GSE64813 and GSE89866. The red points represent up-regulated DEmRNAs with p-value < 0.05; the green points are down-regulated DEmRNAs with p < 0.05. (C) Overlapped DEmRNAs in GSE64813 and GSE89866. (D and E) Hierarchical clustering of the overlapped DEmRNAs in GSE64813 and GSE89866. Each row in the heatmap represents a gene, and each column represents a sample. The color scale at the right of the heatmap represents the raw Z-score ranging from blue (low expression) to red (high expression). (F) Expression heatmap of overlapped DEmRNAs in GTEx normal sample tissues.
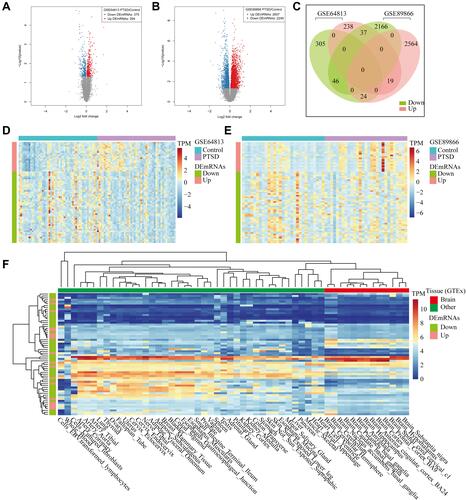
Figure 3 Paired differential expression analyses between PTSD and control. (A) Volcano map of DEmiRNAs expression levels between PTSD and control samples in GSE87768. The red points represent up-regulated DEmRNAs with p < 0.05. (B) Barplot of DEmiRNAs and targets interaction frequency annotated by multiMR tool.
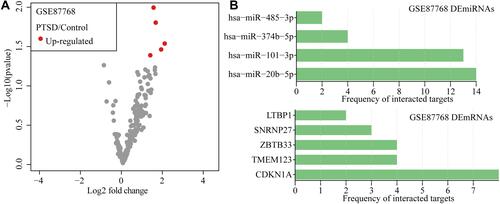
Figure 4 GO and KEGG enrichment analysis for DEmRNAs. (A) GO and KEGG enrichment analysis for DEmRNAs in GSE64813 dataset. (B) GO and KEGG enrichment analysis for DEmRNAs in GSE89866 dataset. (C) GO and KEGG enrichment analysis for DEmRNAs in GSE64813 and GSE89866 datasets. X-axis represents the ratio of mapped genes between DEmRNAs and each GO or KEGG term.
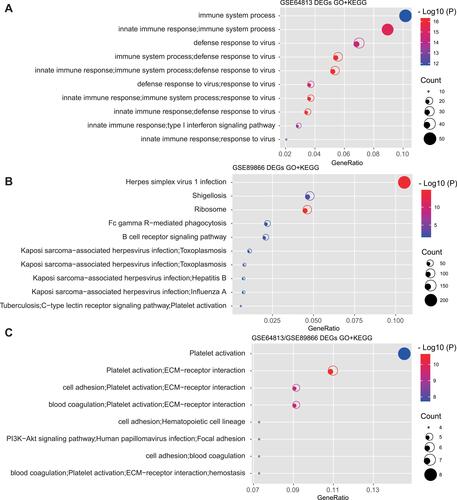
Figure 5 PTSD miRNA–mRNA interactome and interacting drugs. (A) Network of differentially expressed miRNAs targeting differentially expressed genes between PTSD and control samples. Triangles are DEmiRNAs and circles are DEmRNAs; edges denote that a miRNA targets the connected gene. The size of the node labels is proportional to fold change. Node color characterizes the direction of the expression change between controls and PTSDs. (B) Drugs interacted with overlapped DEmRNAs. Gene and potential interacted drugs are connected with lines. The interaction types are represented by different arrows.
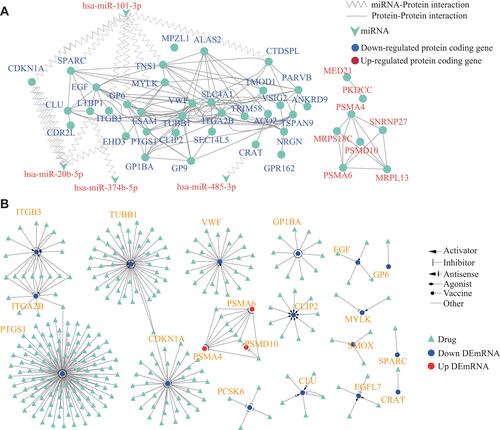
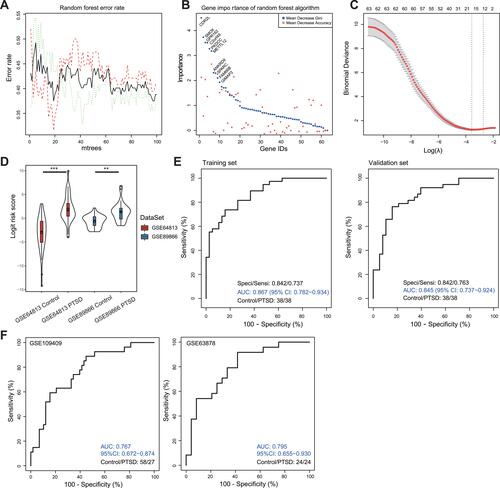
Figure 6 PTSD risk score model construction and validation. (A) Error rate generated from random forest analysis in the training cohort. (B) The importance of DEmRNAs evaluated by random forest algorithm. Top 10 important gene symbols were presented. (C) Misclassification error for different numbers of variables revealed by the LASSO regression model. The red dots represent the value of the misclassification error, the grey lines represent the standard error (SE), the two vertical dotted lines on the left and right, respectively, represent optimal values by the minimum criteria and 1-SE criteria. “Lambda” is the tuning parameter. (D) Distribution of risk score in different datasets. The box plots inside the violin indicate the median value and interquartile range of PTSD risk score. (E) ROC of the PTSD risk score model in the training and validation cohorts. (F) ROC analysis for the 17 DEmRNA based diagnostic prediction model in two independent datasets GSE109409 and GSE63878.