Figures & data
Table 1 Baseline Demographic Data
Figure 1 Principal component analysis (PCA) of the gene expression datasets and differently expressed mRNAs in TAD. The points of the scatter plots visualize the samples based on the top two principal components of gene expression profiles without (A) and with (B) the removal of batch effect. The colors represent samples from three different datasets, respectively. (C) The volcano graph shows the distribution of differently expressed mRNAs. (D) The heatmap of the mRNAs expression in TAD. In the volcano graph, the X-axis represents the fold changes of differently expressed mRNAs, and the Y-axis represents the adjusted p-value, red dots present up-regulated genes and blue dots present down-regulated genes (|log2foldChange| >1.0 and adjusted P value <0.05).
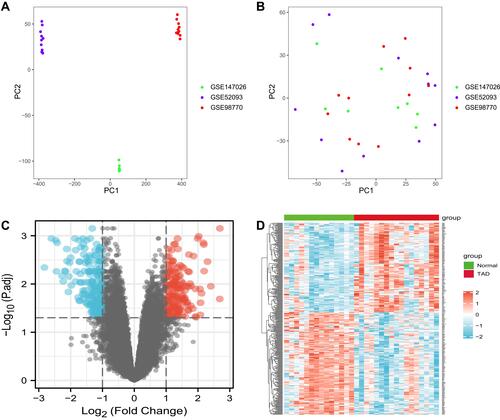
Figure 2 Differently expressed miRNAs and lncRNAs in TAD. (A) The volcano graph shows the distribution of differently expressed miRNAs. (B) The heatmap of the miRNAs expression in TAD. (C) The volcano graph shows the distribution of differently expressed lncRNAs. (D) The heatmap of the lncRNAs expression in TAD. In the volcano graph, the X-axis represents the fold changes of differently expressed miRNAs and lncRNAs, and the Y-axis represents the p-value, red dots present up-regulated genes and blue dots present down-regulated genes (|log2foldChange| >1.0 and P value <0.05).
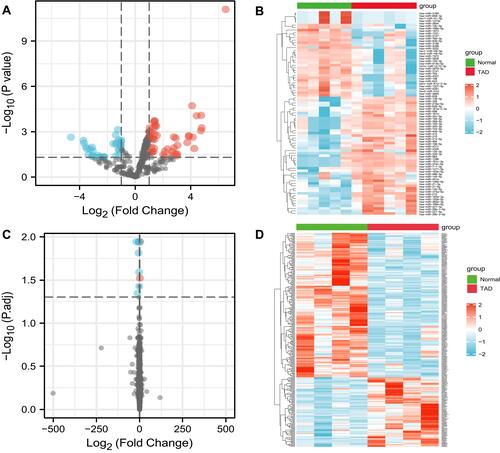
Figure 3 Gene ontology (GO) and Kyoto Encyclopedia of Genes and Genomes (KEGG) pathway analyses of differently expressed mRNA. (A) GO and KEGG pathway analyses of up-regulated genes. (B) GO and KEGG pathway analyses of down-regulated genes. (C) Protein–protein interaction network of differently expressed mRNA (red indicates up-regulation, and green indicates down-regulation). (D) Protein–protein interaction network of top 20 mRNAs. The color changes from dark red to light red indicate the MCC score changes from high to low.
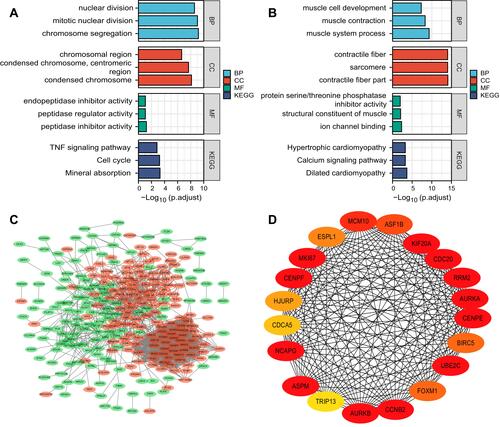
Figure 4 The miRNA-lncRNA-mRNA ceRNA network is composed of 7 lncRNAs, 3 miRNAs and 3 mRNAs. Rectangles, triangles and ellipses represent mRNAs, miRNA and lncRNAs, respectively, while red indicates up-regulation, and green indicates down-regulation.
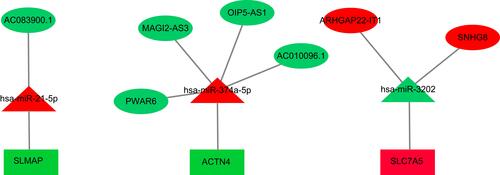
Figure 5 Independent dataset (GSE153434) and quantitative real-time PCR validation of the three key mRNA between TAD and normal controls. (A–C) SLMAP, ACTN4 and SLC7A5 expression based on GSE153434 for TAD. (D–F) Relative mRNA expression of SLMAP, ACTN4 and SLC7A5 was detected by RT-PCR. All experiments were performed in triplicate and results were presented as Median ± interquartile range.
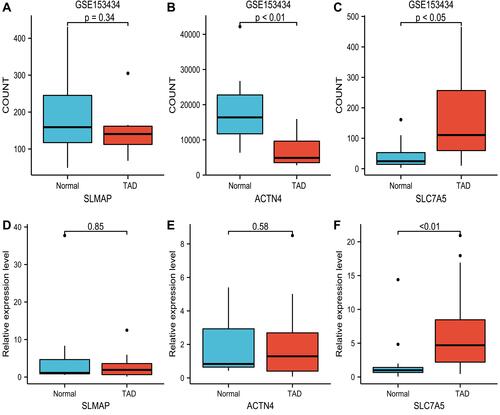
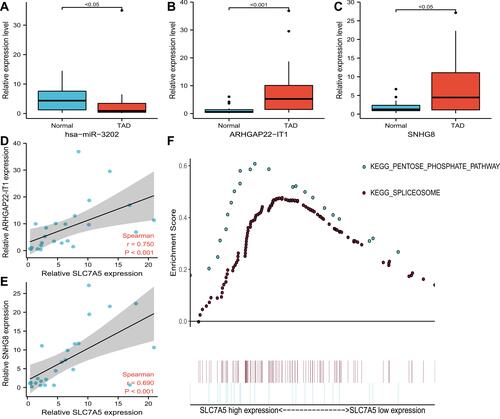
Figure 6 Validation of the expression of representative dysregulated lncRNAs and miRNAs by quantitative qRT-PCR in TAD, the correlation between expression levels of ceRNAs, and GESE analysis of SLC7A5. (A) Validation of the expression of hsa-miR-3202. (B) Validation of the expression of ARHGAP22-IT1. (C) Validation of the expression of SNHG8. (D) correlation between expression levels of SLC7A5 and ARHGAP22-IT1. (E) correlation between expression levels of SLC7A5 and SNHG8. (F) GSEA analysis of SLC7A5.