Figures & data
Figure 1 A pedigree with family type 2 diabetes. Subject 1, 2, 3, 4, 5, 6 and 7 represented diabetes patient 1, 2, 3, 4, 5, no-diabetes patient 6 and diabetes patient 7, respectively. I G1, II G2 and III G3 represented the generation 1, generation 2 and generation 3, respectively.
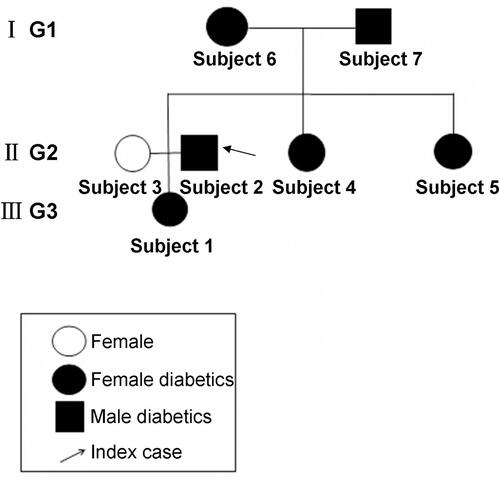
Figure 2 Agarose gel electrophoresis of 7 DNA samples from family members. M1 is λ-Hind III digest DNA Ladder. M2 is D2000 DNA Marker, and 1–7 are DNA samples.
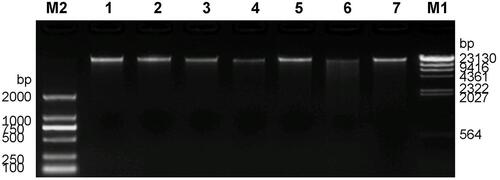
Table 1 Statistical Graph of Exon Sequencing Data from 7 Family Members
Figure 3 Manhattan map of all SNP sites (A) and Manhattan map of significant SNP mutation sites, marks the SNP sites with high significance (P<1e-9) (B).
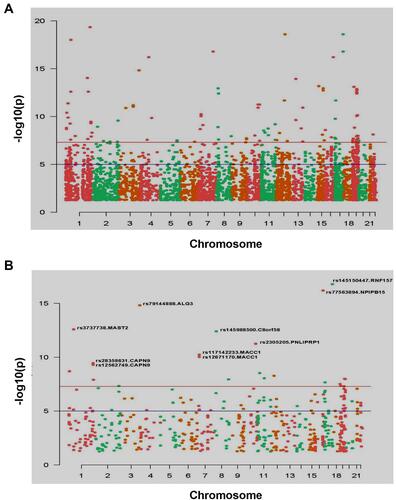
Figure 4 Manhattan map of all Indel mutation sites (A) and Manhattan map of Indel mutation sites that can change the function of protein, and marks the Indel site with high significance (P<1e-9) (B).
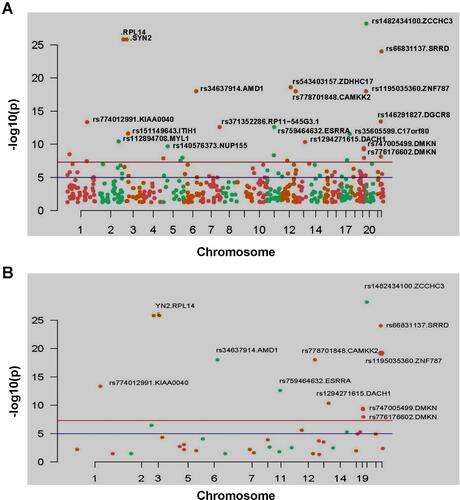
Table 2 List of Significant Mutation Sites in Pedigree
Figure 5 Diagram of the effect of rs2305205 mutation on protein function. (A) Indicates the mode of interaction of Ala271 with other amino acid residues in the unmutated local structure. The hydrogen bond is indicated by a green dotted line, the bond length is identified by a number, and the hydrophobic effect is represented by a semicircle. (B) Mode of interaction of Val271 with other amino acid residues in the local structure after mutation. The effect on protein structure before and after the mutation was obtained from PDB sum, where the PDB ID number of PNLIPRP1 was 2 ppl.
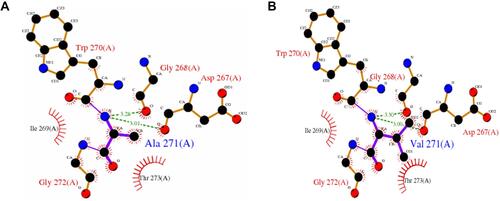
Figure 6 The KEGG pathway map of PNLIPRP1 involved in the process of triglyceride metabolism.
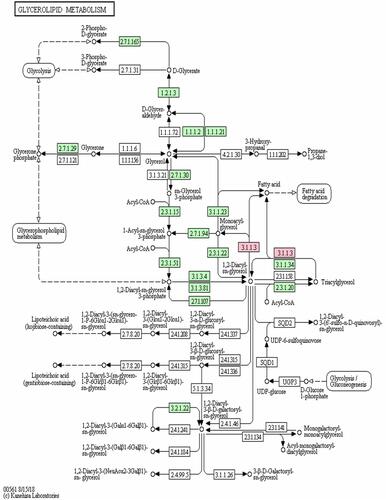
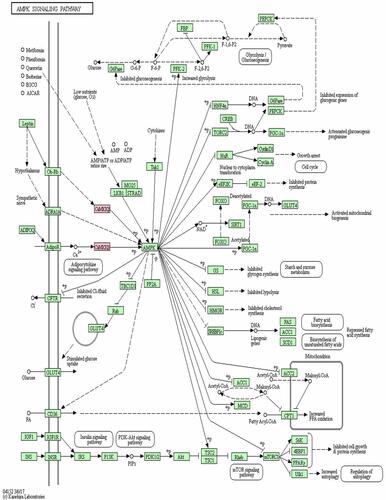
Figure 7 The KEGG pathway map of CAMKK2 participating in AMPK signaling pathway.