Figures & data
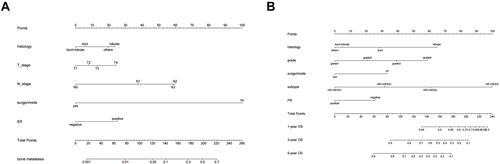
Figure 1 The flow chart and the screening of BCBM related variables. (A) The flow chart. There are 16,972 patients included in this study based on the inclusion and exclusion criteria. (B and C) LASSO regression is used to screen variables. (D) Forest plots are used to delineate the independent risk factors of BCBM.
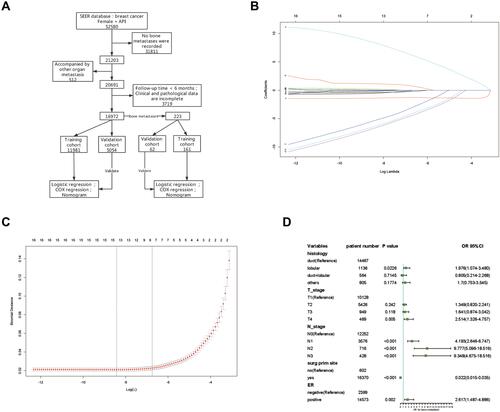
Table 1 Clinical and Pathological Features of Patients in the Study Cohort
Table 2 Clinical and Pathological Features of BCBM Patients in the Study Cohort
Table 3 Univariate and Multivariate Logistic Regression Analysis of Risk Factor of Bone Metastasis in Training Cohort
Figure 2 The nomogram to predict BCBM. Five independent risk factors were used to construct the nomogram; the total point can be obtained by summing the scores of each variable, and the probability of BCBM for each patient can be predicted.
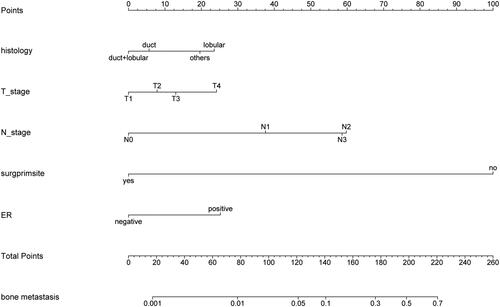
Figure 3 The evaluation of the nomogram to predict BCBM. The ROC curve in the training cohort (A) and the validation cohort (B). The C-index is represented by the area under the curve. The calibration curve in the training cohort (C) and the validation cohort (D). The C-index is represented by the area under the curve. The closer the curve is to the dashed line with a slope of 45°, the higher the calibration of the nomogram.
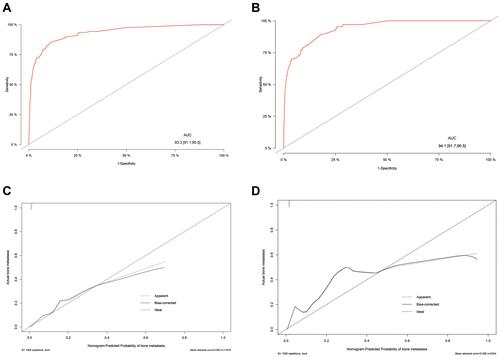
Table 4 Univariate and Multivariate Cox Regression Analysis of Breast Cancer in Training Cohort
Figure 4 The screening of the prognostic variables of BC and the construction of the nomogram. (A and B) LASSO regression was used to screen variables. (C) Forest plots were used to delineate the prognostic factors of BC. (D) The nomogram to predict the prognosis of BC in 1, 3, and 5 years.
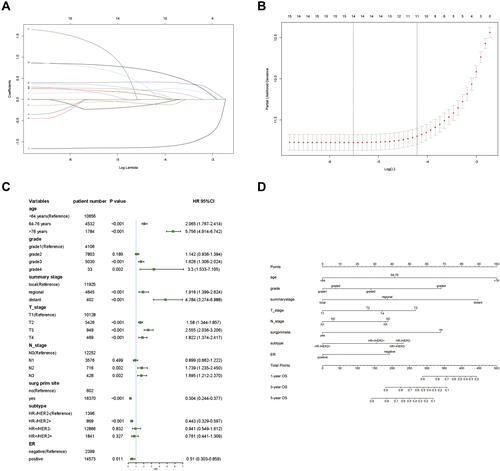
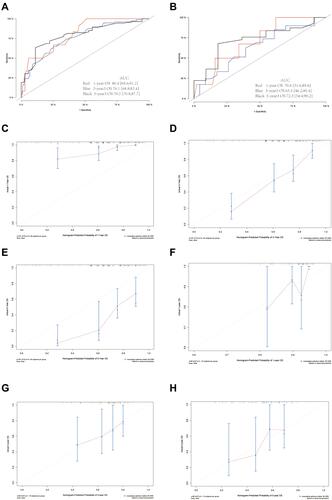
Figure 5 The evaluation of the nomogram to predict the prognosis of BC. The ROC curve in the training cohort (A) and the validation cohort (B) in 1, 3, and 5 years. The C-index is represented by the area under the curve. The calibration curves in the training cohort (C–E) and the validation cohort (F–H) in 1, 3, and 5 years. The C-index was represented by the area under the curve. The closer the curve is to the dashed line with a slope of 45°, the higher the calibration of the nomogram.
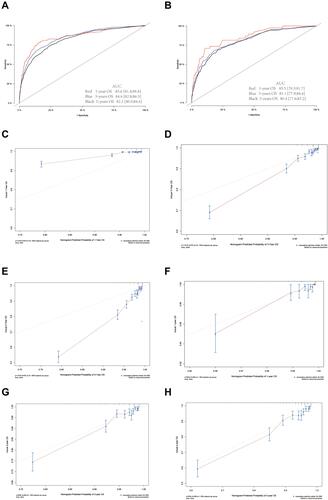
Table 5 Univariate and Multivariate Cox Regression Analysis of BCBM in Training Cohort
Figure 6 The screening of the prognostic variables of BCBM and the construction of the nomogram. (A and B) LASSO regression was used to screen variables. (C) Forest plots were used to delineate the prognostic factors of BCBM. (D) The nomogram to predict the prognosis of BCBM in 1, 3, and 5 years.
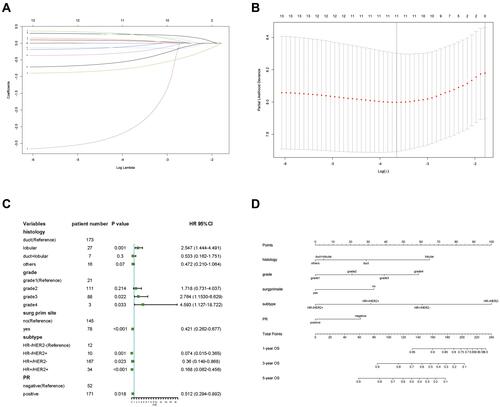
Figure 7 The evaluation of the nomogram to predict the prognosis of BCBM. The ROC curve in the training cohort (A) and the validation cohort (B) in 1, 3, and 5 years. The C-index is represented by the area under the curve. The calibration curve in the training cohort (C–E) and the validation cohort (F–H) in 1, 3, and 5 years. The C-index if represented by the area under the curve. The closer the curve is to the dashed line with a slope of 45°, the higher the calibration of the nomogram.