Figures & data
Figure 1 Workflow describing each step involved in the construction of the SARS-CoV-2-associated ceRNA network and identification of key targets.
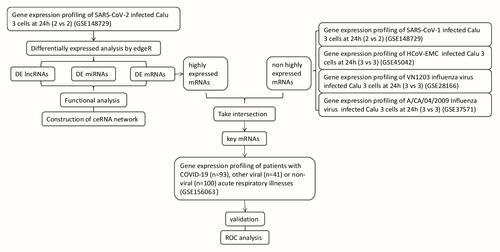
Figure 2 Volcano plots and heat maps for differentially expressed lncRNAs, miRNAs, and mRNAs in GSE148729. First line, volcano plots for all SARS-CoV-2-related (A) mRNAs, (B) lncRNAs, and (C) miRNAs; Second line, heat maps showing differentially-expressed (D) mRNAs, (E) lncRNAs, and (F) miRNAs with a fold change ≥ 3 (p<0.05), respectively.
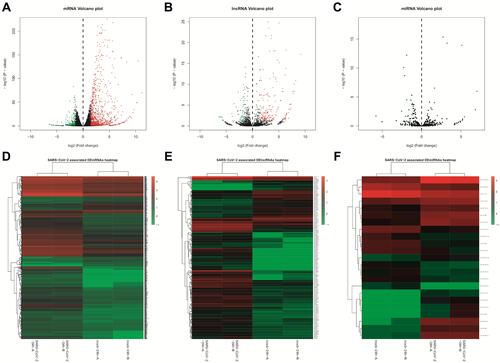
Figure 3 GO annotations for SARS-CoV-2-related DEmRNAs. (A) The representative GO terms were visualized by GOplot R-package. (B) Top 20 GO biological process terms (p < 0.05), (C) molecular function terms (p < 0.05), and (D) cellular component terms (p < 0.05).
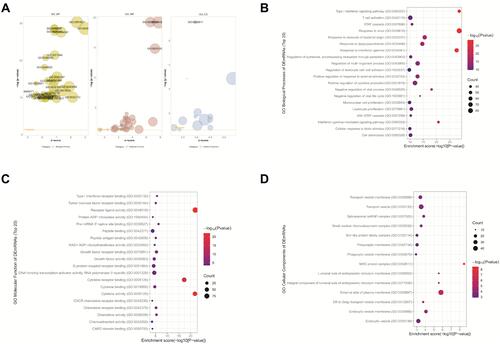
Figure 4 KEGG pathway analysis for SARS-CoV-2-related DEmRNAs. (A) Top 20 enriched KEGG pathways (p < 0.05). (B) Interactions and overlap among the essential KEGG pathways. Green hexagons represent enriched pathways; “V” shapes represent mRNAs; blue and red nodes show decreased and increased expression of mRNAs, respectively. The colors are associated with the absolute value of fold change.
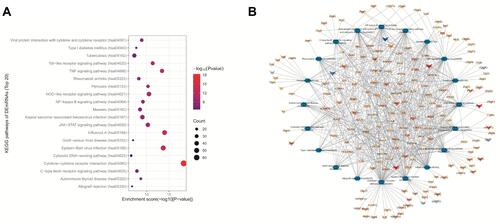
Figure 5 Construction of the SARS-Cov-2-associated lncRNA-miRNA-mRNA ceRNA network. (A) In the ceRNA network, ellipses represent mRNAs, diamonds represent lncRNAs, triangles represent miRNAs, and gray edges represent interactions among the miRNAs-lncRNAs and mRNAs. In addition, the blue and red nodes show decreased and increased expression of RNAs, respectively. The colors are associated with the absolute value of fold change. (B) The cytokine-related regulatory network. (C) The significantly enriched GO biological process terms (p < 0.05) and related genes in the ceRNA network. (D) The enriched KEGG pathways (p < 0.05) and related genes in the ceRNA network.
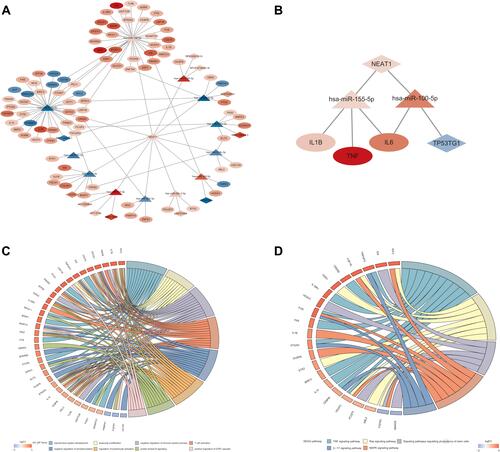
Figure 6 The protein–protein interaction (PPI) network for the ceRNA network-related genes. (A) In the network, the size of the nodes represents the degree of each node. (B and C) The two modules modularized by MCODE from the PPI network. (D) The ceRNA sub-network based on hub genes, ellipses represent mRNAs, diamonds represent lncRNAs, and triangles represent miRNAs.
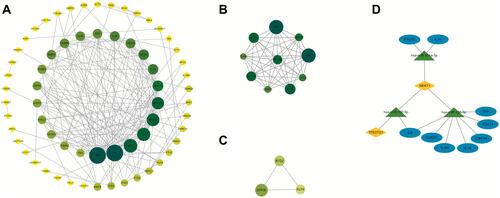
Figure 7 Venn diagram showing the overlap between the SARS-CoV-1-, H5N1-, CA04-, HCoV-EMC-related non-highly expressed mRNAs and the SARS-CoV-2-related highly expressed mRNAs (A). The relative expression of (B) IFI6, (C) HRASLS2, (D) IGFBP4 and (E) PTN in COVID-19 (n=93), other viral (n=41), or non-viral (n=100) acute respiratory illnesses samples, *p < 0.05, **p < 0.01,***p < 0.001, ****p < 0.0001 by unpaired t-test.
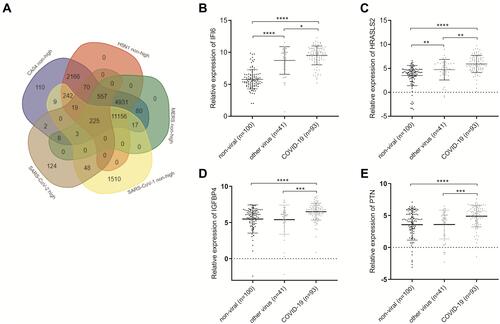
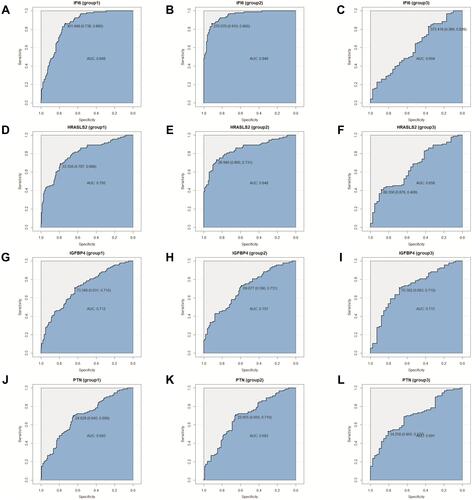
Figure 8 ROC curves of (A–C) IFI6, (d-f) HRASLS2, (G–I) IGFBP4 and (J–L) PTN in three groups (group 1: COVID-19 vs other viral and non-viral ARIs; group 2: COVID-19 vs non-viral ARIs; group 3: COVID-19 vs other viral ARIs).