Figures & data
Figure 1 Five immune-related prognosis-associated lncRNAs and their coefficients obtained by LASSO regression.
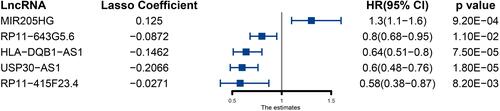
Figure 2 Construction and validation of immune-related prognostic lncRNA signature of cutaneous melanoma in the training group, test group and combined group. (A) Risk score curves and survival status distribution plots of immune-related lncRNA signature in the training, test and combined groups. (B) Kaplan–Meier survival curves of the immune-related lncRNA signature in the training, test and combined groups. (C) Time-dependent ROC curves of the immune-related lncRNA signature in the training, test and combined groups.
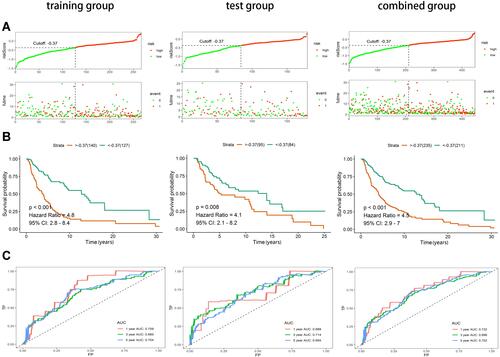
Figure 3 Assessing the ability of immune-related lncRNA signature in cutaneous melanoma as an independent prognostic factor. (A) Univariate Cox regression analysis of age, gender, stage, TNM stage and risk score. (B) Multivariate Cox regression analysis for age, gender, stage, TNM stage and risk score. (C) Calculate the AUC for age, gender, stage, TNM stage and risk score based on multifactorial ROC curves.
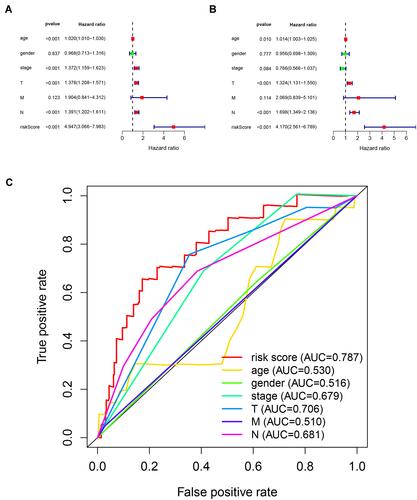
Figure 4 Immune infiltration status of cutaneous melanoma. (A) Correlation between 22 types of immune cells. (B) Infiltration status of 22 types of immune cells in cutaneous melanoma. (C) Differences in immune cell infiltration in high- and low-risk groups. *Indicates P value < 0.05; **indicates P value < 0.01; ***indicates P value < 0.001; ****indicates P value < 0.0001; ns indicates P value > 0.05.
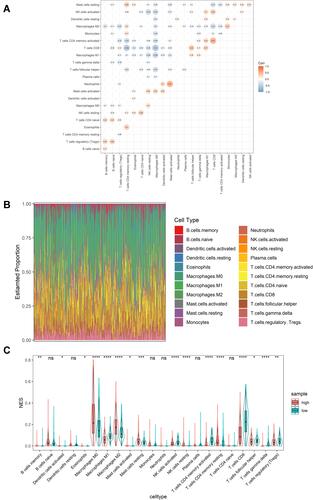
Figure 5 GSEA analysis to assess immune infiltration and pathway enrichment differences in high and low risk populations. (A) Immune response. (B) Immune system process. (C) Toll-like receptor signaling pathway. (D) Chemokine signaling pathway. (E) JAK-STAT signaling pathway. (F) GPI anchor biosynthesis. (G) glyoxylate and dicarboxylate metabolism.
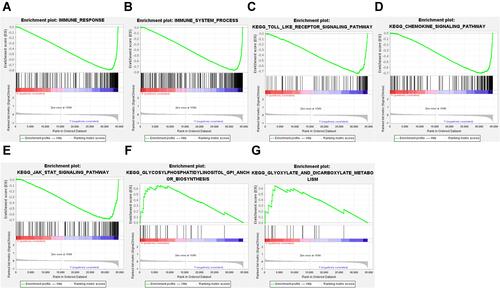
Figure 6 Impact of immune-related lncRNA signature and immune checkpoint-related gene expression on survival outcome in cutaneous melanoma. (A) Differences in expression of immune checkpoint-related genes (CTLA-4, PD-1, and PD-L1) in high and low risk populations. Kaplan-Meier survival curves among four-patient-groups stratified by the immune-related lncRNA signature and (B) CTLA-4, (C) PD-1 and (D) PD-L1 expression.
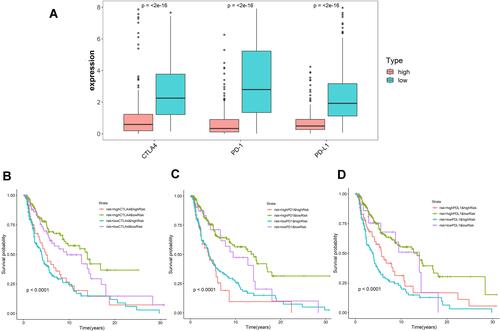
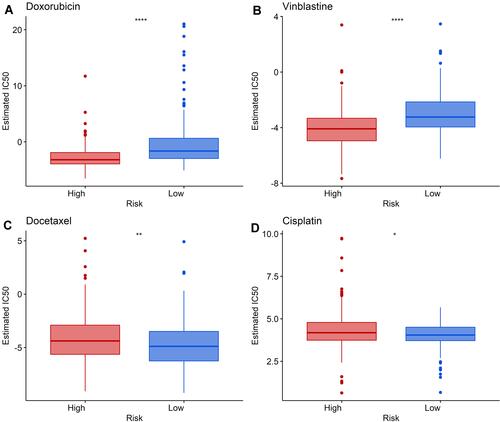
Figure 7 Differences in sensitivity to chemotherapeutic agents between high- and low-risk groups. (A and B) The low-risk group was associated with a higher IC50 of Doxorubicin and Vinblastine. (C and D) The high-risk group was associated with a higher IC50 of Docetaxel and Cisplatin. *Indicates P value < 0.05; **indicates P value < 0.01; ****indicates P value < 0.0001.