
Figures & data
Figure 1 Sleeve pouch after stapling.
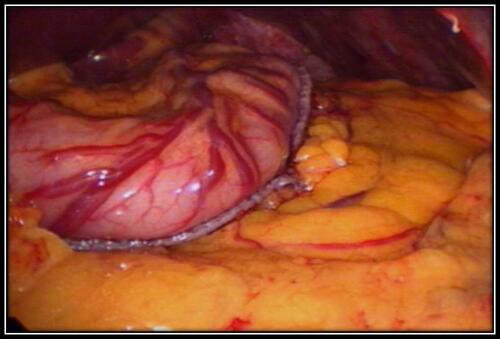
Table 1 Baseline Characteristics of the Whole Studied Group (n = 120)
Table 2 Change of Weight and Body Mass Index Throughout the Follow-Up Period (n = 119)
Table 3 Percentage of Excess Weight Loss (%EWL) Throughout the Follow-Up Period (n = 119)
Table 4 Correlation of Preoperative Gastric Volume with Patients’ Characteristics and Postoperative Weight Loss (n = 119)