Figures & data
Figure 1 Screening OS-related TFTGS based on NES followed by unsupervised cluster. (A) NES heatmap of TFTGS via ssGSEA. (B) (I~XIV) survival curve of OS-related 14-TFs screened by combining KM and Cox methods. (C) Consensus cluster matrix (I) based on NES, consensus index (II), delta area of k (III), and externally validated cluster method of k (IV). (D) PCA (I) and tSNE (II) result based on NES.
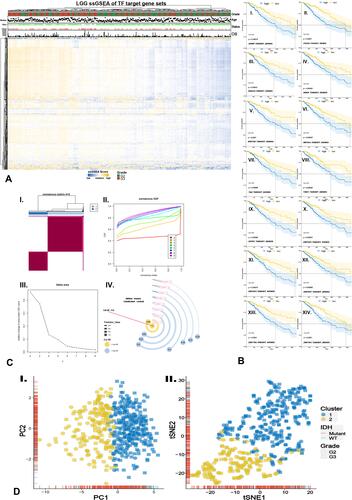
Figure 2 Distributions of hTFs’ expression and clinical features between Cluster1/2. (A) Heatmap of NES in hTFs and clinical features between Cluster1/2 (Wilcoxon test), molecular functional annotation of hTFs (***p<0.001, *p<0.05). (B) Survival curve of Cluster1/2. (C) Correlation network among hTFs. (D and E) Gene expression of hTFs between Cluster1/2 (D) and LGG/GTEx (E).
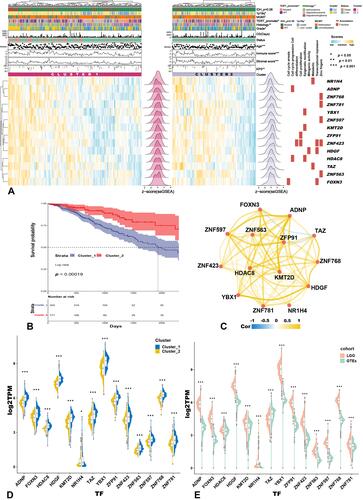
Figure 3 Training predicted model and developing nomogram followed by validation. (A) Lambda value of lasso predicted model (I~II), ROC curve to validate lasso predicted model (III), and survival curve between high/low-risk group generated by lasso algorithm (IV). (B) Gene expressed distribution of kTFs between high/low-risk groups via t-test (***p<0.001). (C) The risk levels between Cluster1/2 (I) and grades (II). (D and H) Uni-Cox analysis of clinical signatures and risk levels via training cohort (D) and validation cohort (H). (G) ROC curve to validate lasso predicted model (I) and survival curve between high/low-risk group in validation cohort. (E and I) Nomogram based on independent indicators of training cohort (E) and validation cohort (I). (F and J) Calibration curves of nomogram in training cohort (F) and validation cohort (J).
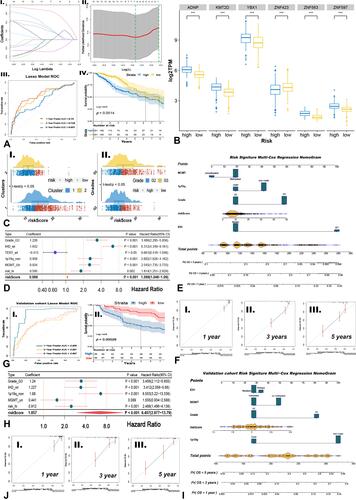
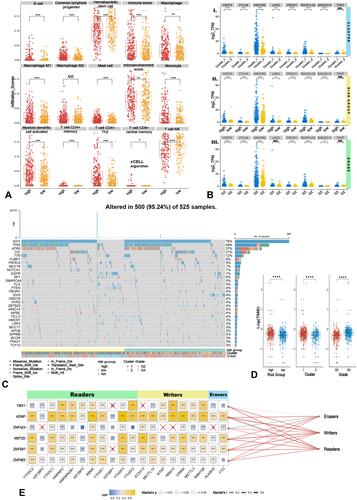
Figure 4 Immune infiltrating levels and TMB status between high/low-risk groups followed by the relationship between kTFs and m6A genes. (A) Significantly enriched terms via xCell algorithm and 14 terms were significantly enriched. (B) Gene expressions of ICPs in Cluster1/2, high/low-risk group, and grades. (C and D) Heatmap of top 20 frequency mutated genes in LGG (C) and TMB levels in Cluster1/2, high/low-risk group and grades (D). (E) The relationship among kTFs, m6A genes, and m6A process; the mantel test was applied to test the m6A process and kTFs, line’s color referred to p value as well as size referred to relative coefficient. (t-test ****p<0.0001, ***p<0.001, **p<0.01, *p<0.05, NS. p≥0.05).