Figures & data
Table 1 Baseline Characteristics of Patients with Hepatosplenic T Cell Lymphoma from the SEER database
Table 2 Clinical Characteristics of Five Chinese Patients with Hepatosplenic T Cell Lymphoma
Table 3 The Main Immunophenotypic Features of 5 Chinese Cases with Hepatosplenic T Cell Lymphoma
Table 4 The Staging, Treatment, Outcome, and Survival of 5 Chinese Cases with Hepatosplenic T Cell Lymphoma
Figure 1 Overall survival curves of patients with hepatosplenic T cell lymphoma. OS of patients with HSTCL were compared with that in patients with PTCL-NOS among the entire cohort (A) and the same comparison also made between the entire HSTCL cohort and the entire ALK+ ALCL cohort (B). OS of patients with HSTCL were compared with that of patients with PTCL-NOS among the match cohort (C), and OS of patients with HSTCL were compared with that in patients with ALK+ ALCL among the matched cohort (D).
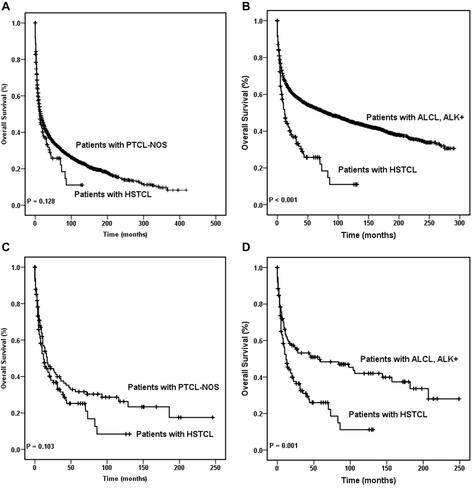
Table 5 Cox Regression Analysis for Survival of Hepatosplenic T Cell Lymphoma Patients
Figure 2 Kaplan–Meier survival curves according to the different treatment. Overall survival curves (A) and disease-specific survival curves (B) were made in the patients with primary spleen and liver HSTCL, respectively.
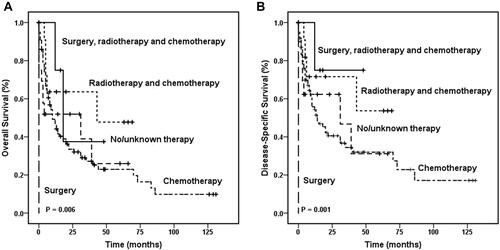
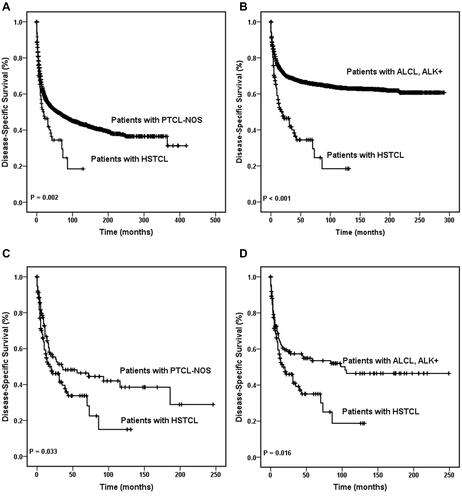
Figure 3 Disease-specific survival curves of patients with hepatosplenic T cell lymphoma. DSS of patients with HSTCL were compared with that in patients with PTCL-NOS among the entire cohort (A) and the same comparison also made between the entire HSTCL cohort and the entire ALK+ ALCL cohort (B). DSS of patients with HSTCL were compared with that of patients with PTCL-NOS among the match cohort (C), and DSS of patients with HSTCL were compared with that in patients with ALK+ ALCL among the matched cohort (D).