Figures & data
Table 1 Clinical Characteristics of the LGG Patients Based on TCGA
Table 2 Correlation Between STK40 Expression and Clinicopathological Characteristics in LGG
Table 3 Logistic Analysis of the Association Between STK40 Expression and Clinical Characteristics
Figure 1 STK40 is significantly upregulated in LGG than normal tissues. (A) The difference expression of TLX1 in LUAD and unpaired normal lung tissues. (B) ROC curve. Significance markers: ***P<0.001.
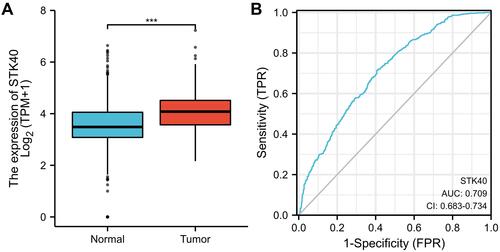
Figure 2 Box plot evaluating STK40 expression of patients with LGG according to different clinical characteristics. (A) WHO grade. (B) 1p/19q codeletion. (C) IDH status. (D) primary therapy outcome. (E) histological type. Significance markers: **P<0.01; ***P<0.001.
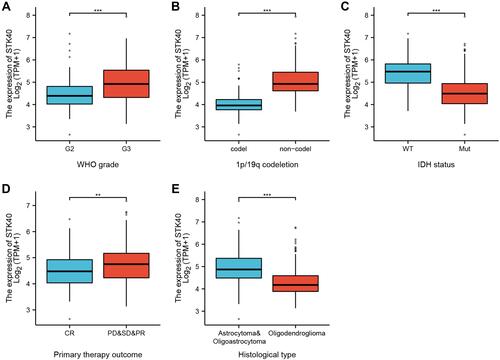
Table 4 Univariate and Multivariate Cox Regression Analyses of Clinical Characteristics Associated with OS
Figure 3 High expression of STK40 is associated with poor OS and DSS in patients with LGG. (A) The Kaplan–Meier curves and number at risk of OS in LGG. (B) The Kaplan–Meier curves and number at risk of PFS in LGG. (C) The Kaplan–Meier curves and number at risk of DSS in LGG.
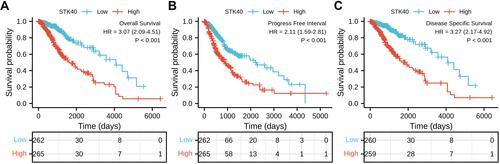
Figure 4 Forest plot of the multivariate Cox regression analysis for LGG.
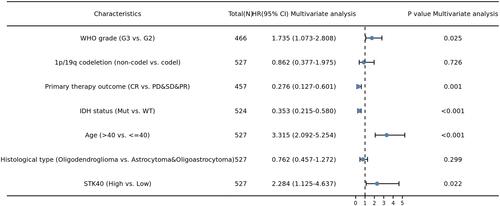
Figure 5 Nomogram for predicting the probability of patients with 1-, 3- and 5-year overall survival.
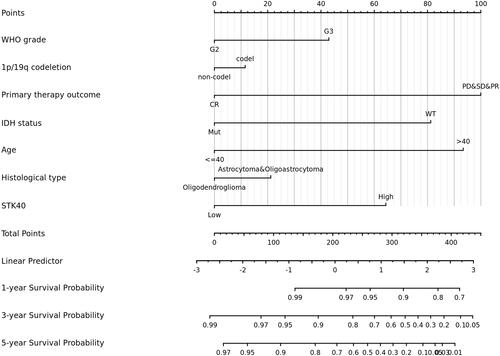
Table 5 Gene Sets Enriched in the High STK40 Expression Phenotype
Figure 6 Enrichment plots from gene set enrichment analysis (GSEA). (A) neutrophil degranulation, (B) signaling by interleukins, (C) GPCR-ligand binding, (D) G alpha (I) signaling events, (E) VEGFAVEGFR-2 signaling pathway, (F) Class A 1 Rhodopsin-Like Receptors, (G) naba secreted factors, (H) PI3K-Akt signaling pathway, and (I) Focal Adhesion-PI3K-Akt-mTOR-signaling pathway, were differentially enriched in STK40-related OC.
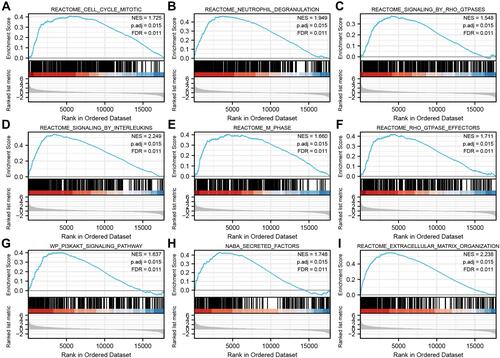
Table 6 The Correlation Between STK40 Expression and Immune Cells Detected by Spearman Correlation Method
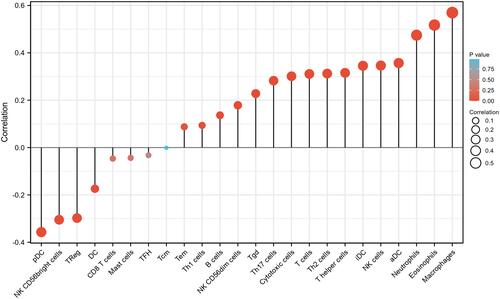
Figure 7 Correlation of STK40 expression levels with immune infiltration (Spearman r).