
Figures & data
Table 1 Demographic Characteristics in Preeclamptic Women [(Mean, SD, (N, %)]
Figure 1 The step-by-step description of the analysis of data.
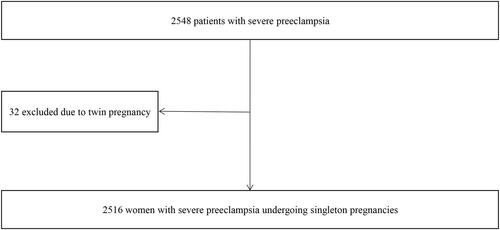
Figure 2 The delivery modes in the four groups (χ2 = 212.88, P = 0.000).
Notes: Group 1 (≤27+ 6 weeks), Group 2 (28–33+ 6 weeks), Group 3 (34–36+ 6 weeks), and Group 4 (≥37 weeks).
Abbreviations: CD, cesarean-section delivery; VD, vaginal delivery.
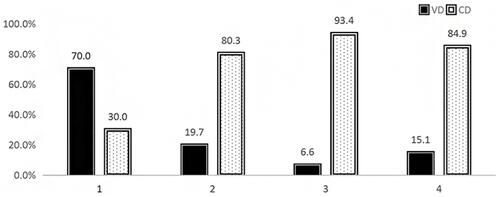
Table 2 Comparison of Maternal Complications in Different Groups [(Mean, SD, (N, %)]
Table 3 Comparison of Maternal Complications Among Different Groups [N, %]
Figure 3 Maternal complications of different delivery modes among the four groups [N, %].
Notes: Group 1 (≤27+ 6 weeks), Group 2 (28–33+ 6 weeks), Group 3 (34–36+ 6 weeks), and Group 4 (≥37 weeks).
Abbreviations: CD, cesarean-section delivery; VD, vaginal delivery; PPH, postpartum hemorrhage.
![Figure 3 Maternal complications of different delivery modes among the four groups [N, %].](/cms/asset/a91357d5-dc2d-4dfb-a14f-3bc2365c3214/dijg_a_12168562_f0003_c.jpg)
Table 4 Comparison of Perinatal Complications of Different Delivery Methods at Different Gestational Ages [N, %]