Figures & data
Table 1 Patient Demographics and Pathological Characteristics
Table 2 Univariate and Multivariate Analyses of Overall Survival in the Training Set
Table 3 Detailed Scores of Prognostic Factors in the Overall Survival Nomograms
Figure 1 Nomograms for predicting the 3-,5-, and 10-year overall survival of solitary bone plasmacytoma patients. Description using nomograms: First, each feature point of the patient is assigned by plotting a vertical line to a point scale from the variable. Then, sum all the points and draw a vertical line from the total point scale to the liver metastasis axis to obtain the probability.
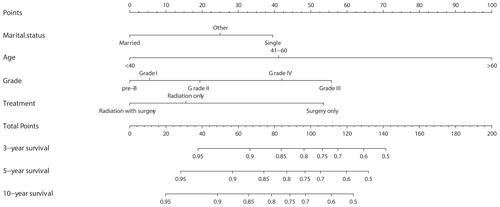
Figure 2 AUC values of ROC predicted overall survival rates of Nomogram in the training cohort (A) and the validation cohort (B).
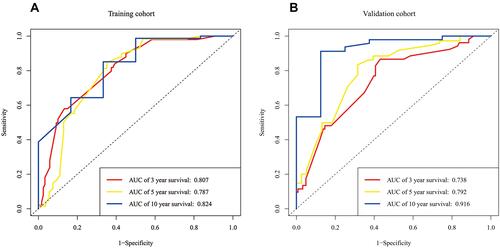
Figure 3 Internal calibration plot. (A) 3-Year, (B) 5-year and (C) 10- year overall survival nomogram calibration curves. The 45-degree line represents an ideal match between the actual survival (Y-axis) and nomogram-predicted survival (X-axis). The perpendicular line means 95% confidence intervals.
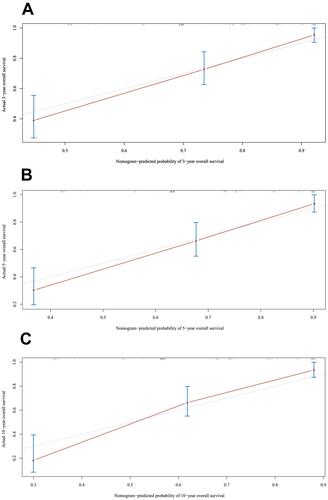
Figure 4 External calibration plot. (A) 3-Year, (B) 5-year and (C) 10- year overall survival nomogram calibration curves. The 45-degree line represents an ideal match between the actual survival (Y-axis) and nomogram-predicted survival (X-axis). The perpendicular line means 95% confidence intervals.
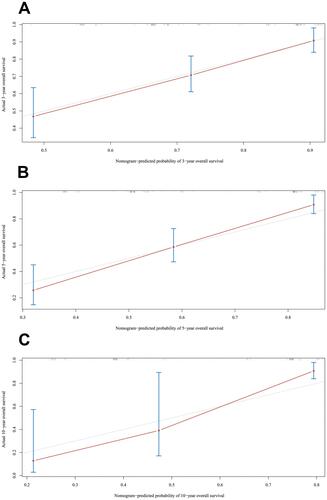
Figure 5 Decision curves of the nomogram predicting OS at (A) 3 years, (B) 5 years and (C) 10 years in the training cohort and at (D) 3 years, (E) 5 years and (F) 10 years in the validation cohort.
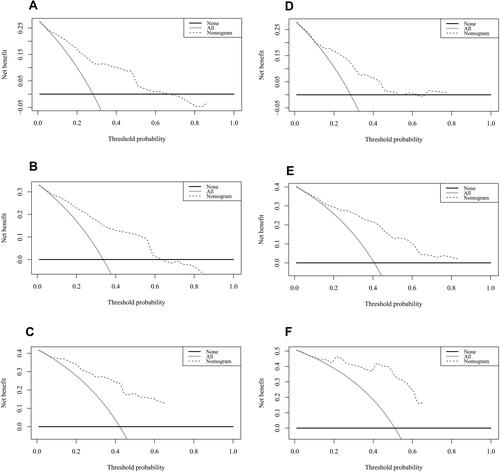
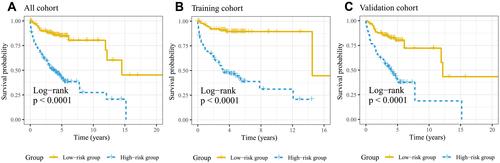
Figure 6 Kaplan–Meier curves of overall survival for patients in the low-, and high-risk groups (A–C).