Figures & data
Table 1 Summary of Clinical and Image Characters
Table 2 The Cost Functions of IMRT Planning for ESCC
Figure 1 Box plot (A) of the parameters of organ at risks (OARs). Forest plot (B) of the OARs between different MSW groups.
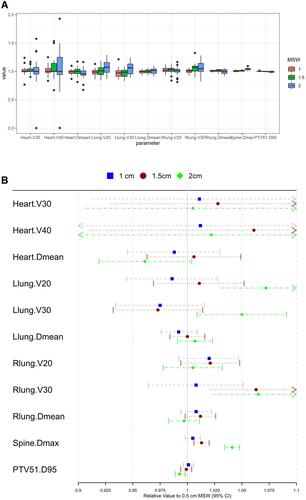
Figure 2 Box plot (A) of the HI and CI of PTV60 and PTV51. Forest plot (B) of HI and CI of the PTV60 and PTV51 between different MSW groups.
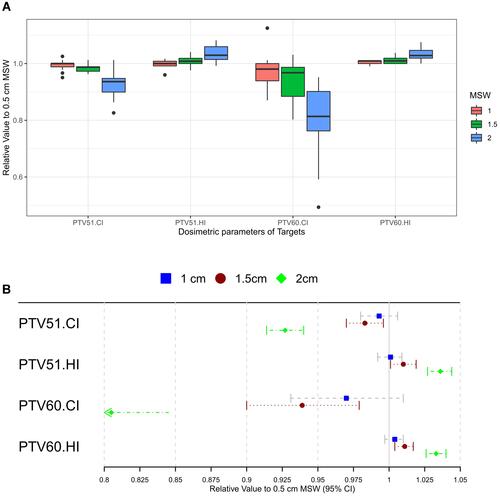
Figure 3 Box plot (A) and forest plot (B) of MU, CP and delivery time among different MSW groups.
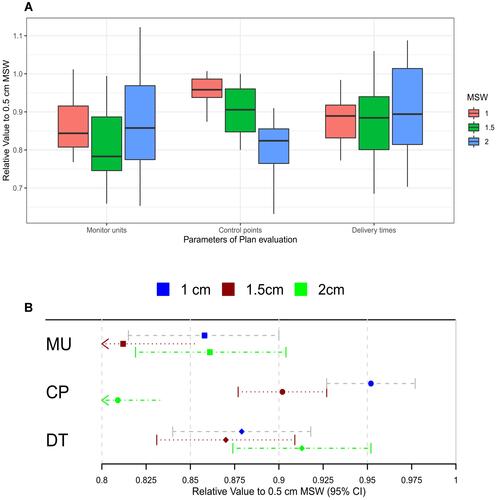
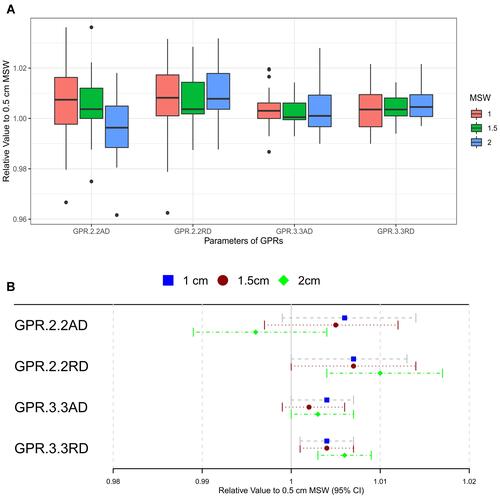
Figure 4 Box plot (A) and forest plot (B) of GPR among different MSW groups.