Figures & data
Figure 1 DEGs and PCA results. (A) DEGs between postmenopausal osteoporosis and healthy control samples; (B) PCA showed no significant batch effect.
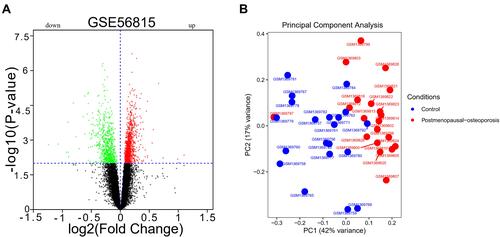
Figure 2 Weighted gene co-expression network analysis results. (A) Sample dendrogram and trait heatmap; (B) Scale Independence and mean connectivity; (C) Cluster dendrogram; (D) Network heatmap of 400 randomly selected genes; (E) Module trait relationships; (F) Scatter plot genes in blue module.
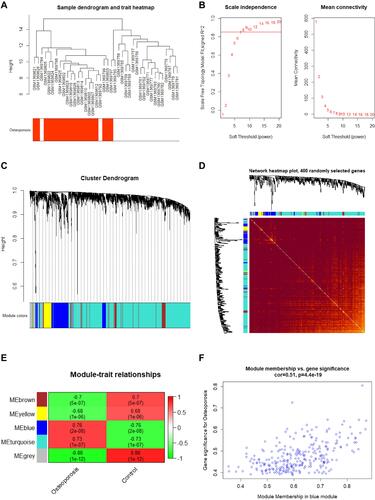
Table 1 Detail of 20 Significant KEGG Pathway Enriched in Postmenopausal Osteoporosis Analyzed by GSEA
Figure 3 The enrichment analysis of the selected module genes. (A) Biological process; (B) Molecular function; (C) Cell component; (D) Kyoto Encyclopedia of Genes and Genomes (KEGG).
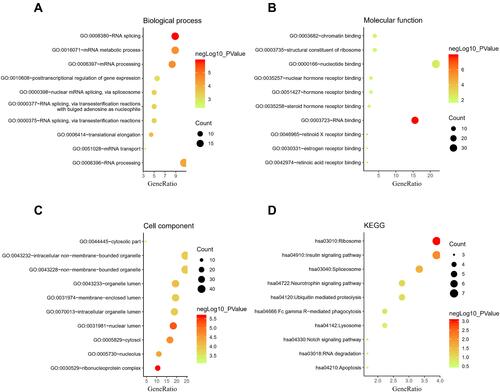
Figure 4 Gene Set Enrichment Analysis results. (A) KEGG_PHENYLALANINE_METABOLISM; (B) KEGG_CYTOKINE_CYTOKINE_RECEPTOR_INTERACTION; (C) KEGG_NEUROACTIVE_LIGAND_RECEPTOR_INTERACTION; (D) KEGG_HEDGEHOG_SIGNALING_PATHWAY; (E) KEGG_STEROID_HORMONE_BIOSYNTHESIS; (F) KEGG_MATURITY_ONSET_DIABETES_OF_THE_YOUNG.
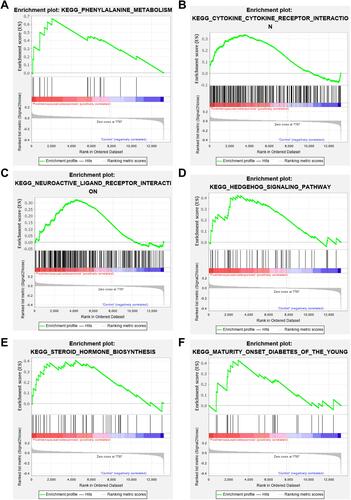
Table 2 The Information of 10 Hub Genes in Postmenopausal Osteoporosis
Figure 5 Protein-protein interaction (PPI) network and hub gene identification. (A) PPI network; (B) MCODE genes; (C) Common genes between MCODE genes, postmenopausal osteoporosis associated genes in CTD and the miRNAs predicted genes; (D) Pearson clustering heatmap of hub genes.
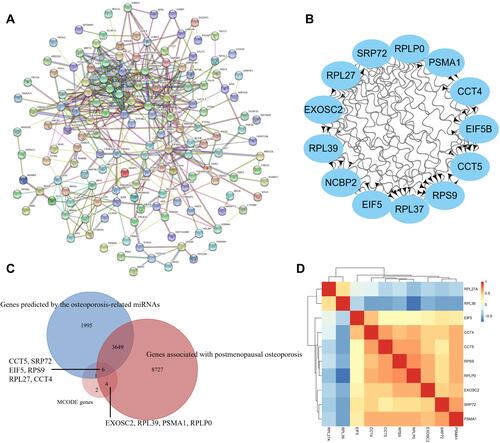
Table 3 The Hub Genes Associated with Postmenopausal Osteoporosis in CTD
Figure 6 Interaction between hub genes and Musculoskeletal Diseases, Arthralgia, Cartilage Diseases, Osteoporosis, Metabolic Bone Diseases, Bone Resorption. (A) CCT5, (B) SRP72, (C) EIF5, (D) RPS9, (E) RPL27, (F) CCT4.
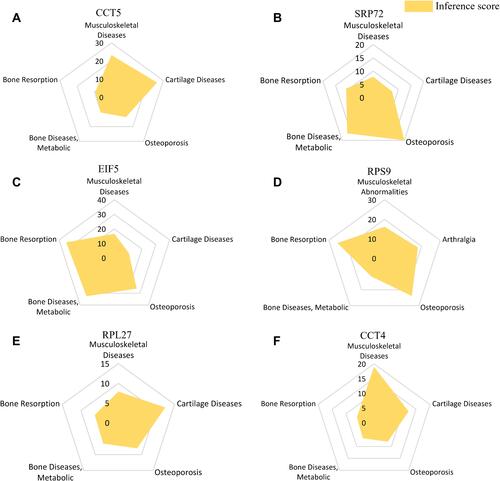
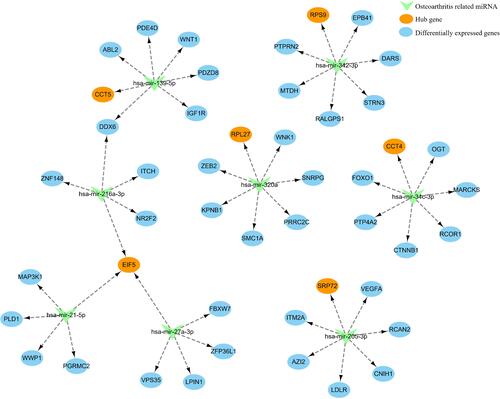
Figure 7 miRNA-mRNA network of hub genes and predicted miRNAs.